Product Tour
A screen-by-screen tour of the DataMaxi+ hosted product, in the order the left navigation presents it — from the Dashboard read to the Trend discovery surface.
Dashboard
The Dashboard is the entry screen after you log in — a single-glance read on the market, with shortcuts into every other section.
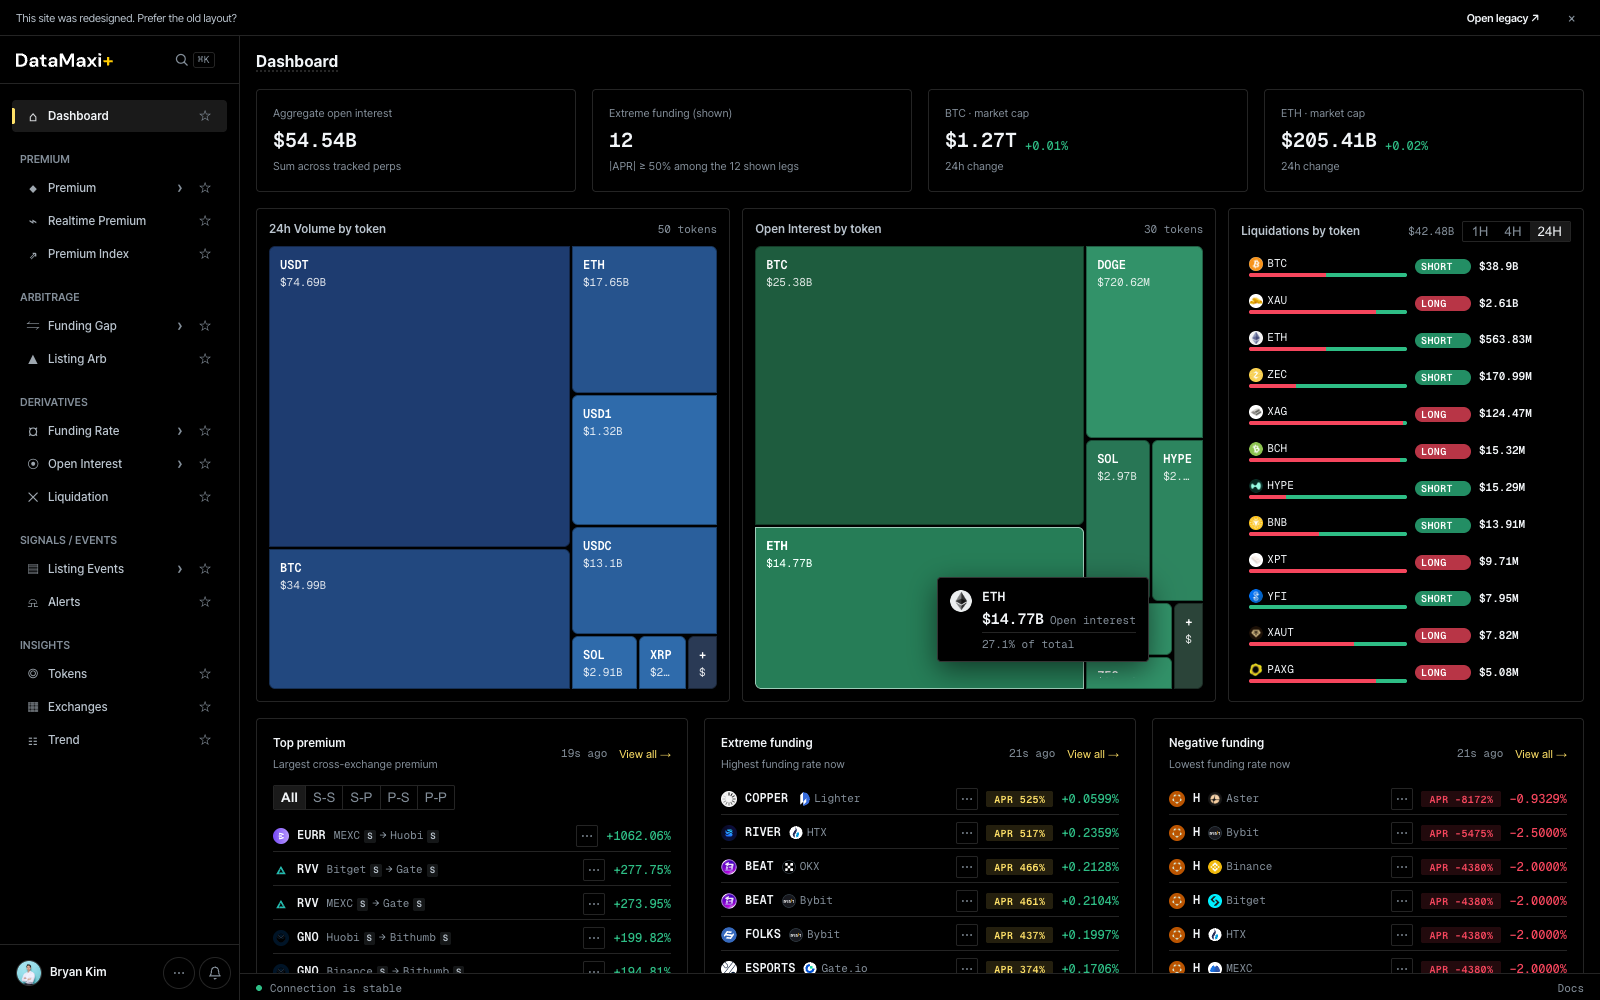
Top stat row
Four headline numbers across the full width:
- Aggregate open interest — total notional OI across every tracked perpetual.
- Extreme funding (count) — number of tokens currently at extreme funding (very long-pays-short or short-pays-long), with the venue spread inside the row.
- BTC market cap — with 24h delta.
- ETH market cap — with 24h delta.
Treemaps
Two large treemaps side by side:
- 24h Volume by token — share of total 24h spot + perp volume per token (USDT, ETH, BTC, SOL, XRP…). Cell size encodes volume share, cell color encodes 24h price change.
- Open Interest by token — share of total perp OI per token. Same color encoding.
Liquidations by token
Right-rail panel with window toggle (1H · 4H · 24H). Each row shows a token, the long vs short split as a horizontal bar (red = long liquidations, green = short), and the dollar size.
Bottom strips
Three side-by-side panels, each with a View all → jump-link:
- Top premium — largest cross-exchange premium right now. Strategy pill row (
All · S-S · S-P · P-S · P-P) lets you filter to the spot-spot / spot-perp / perp-spot / perp-perp leg you trade. - Extreme funding — highest funding rates right now, both extremes.
- Negative funding — lowest (most negative) funding rates.
When to use this page
- Start of session — quick read on where attention should go.
- Spot anomalies (one cell dominating the OI treemap, a token suddenly topping liquidations).
- Jump straight to the deeper view via
View all →on any panel.
Premium
The Premium screener ranks every cross-exchange spread that matters — by side, by direction, by venue, with hard filters for what you can actually execute.
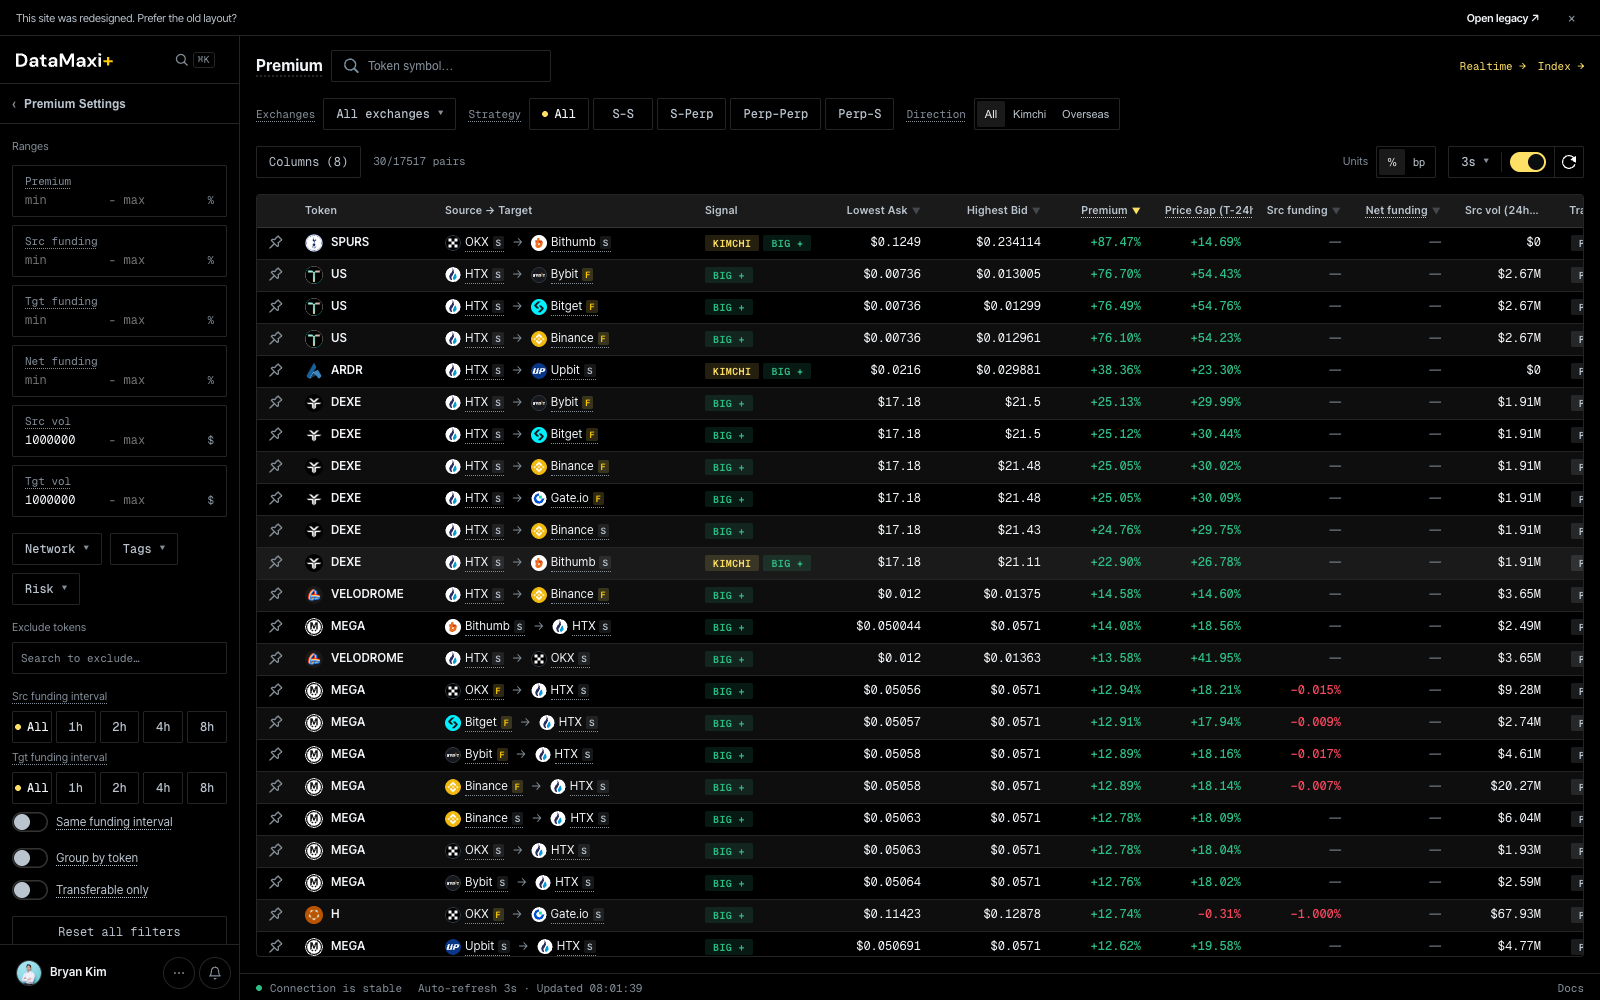
Header controls
Top of the screen:
- Token symbol search — filter the table to a specific base asset.
- Exchanges · All exchanges ▼ — multi-select venue filter.
- Strategy pills —
All · S-S · S-Perp · Perp-Perp · Perp-S. Picks which legs are eligible (spot-spot, spot-perp, etc.). - Direction pills —
All · Kimchi · Overseas. Filters to KRW-market premium (Kimchi) or non-Korean cross-venue spreads. - Units toggle —
% / bp(basis points). - Refresh interval — default 3s; toggle on/off.
Premium Settings (left rail)
The collapsible left rail holds all the filters you want to set once and forget:
- Ranges —
Premium,Src funding,Tgt funding,Net funding,Src vol,Tgt vol. Each takes amin — maxpair so the table only surfaces spreads big enough to trade. - Network ▼ · Tags ▼ · Risk ▼ — chain, token-tag, and risk-class filters.
- Exclude tokens — search-style add list for permanent blocklists.
- Src / Tgt funding interval — pin the funding cycle on both legs (
All / 1h / 2h / 4h / 8h). - Toggles: Same funding interval (only pairs whose source and target settle on the same cycle), Group by token, Transferable only (exclude pairs where the asset can't be deposited or withdrawn on one of the venues).
- Reset all filters at the bottom.
Main table
Columns (8) is configurable. Default columns include the source venue, target venue, the premium % (or bps), the funding rates on both legs, and 24h volume on both legs. The pair count (x/y pairs) above the table reflects how many pairs survive your current filters.
Inspector
Clicking any row opens a slide-out inspector on the right side of the screen — everything you need to commit to (or pass on) the spread without leaving the page.

The panel itself, zoomed in:
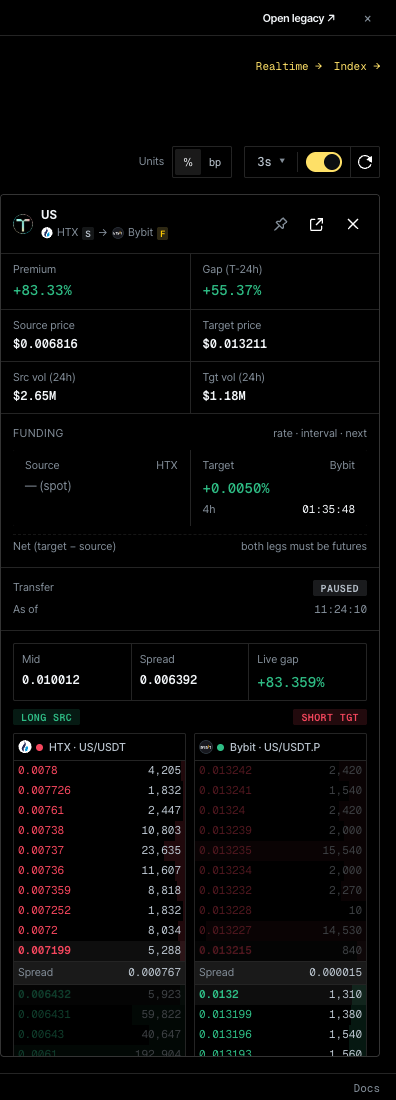
Panel header
- Token + leg pair — e.g.
SPURS · OKX s → Bithumb sshows the asset and the spot/perp annotation on each leg. - Pin — keep this token's inspector pinned so it stays selected as you re-filter the table.
- Open in new view (
↗) and close (✕). - Top-right jumps:
Realtime →(the Realtime Premium matrix for this token) andIndex →(the Premium Index history).
Stats grid
| Block | Reads |
|---|---|
| Premium % | live premium of the pair |
| Gap (T − 24h) | how much the premium has changed vs. 24h ago |
| Source price / Target price | last price on each leg |
| Src vol (24h) / Tgt vol (24h) | 24h volume on each leg — quick liquidity check |
Funding block
rate · interval · next columns for the source and target legs. Net (target − source) lights up only when both legs are futures — the carry edge the inspector flags is the one you can actually collect.
Transfer block
PAUSED / OPEN chip plus the last-checked timestamp. If transfer is paused on either side, the spread isn't tradeable as a transfer-arb — the inspector marks it explicitly.
Telegram posts
A filter row (All / Korea / Global) followed by a feed of recent Telegram messages that mention this token. Useful for catching narrative context — is there news driving this spread, or is it pure venue divergence.
Hidden controls
Customize columns modal
Clicking the Columns (N) button (top-left of the table) opens a drag-to-order column picker.
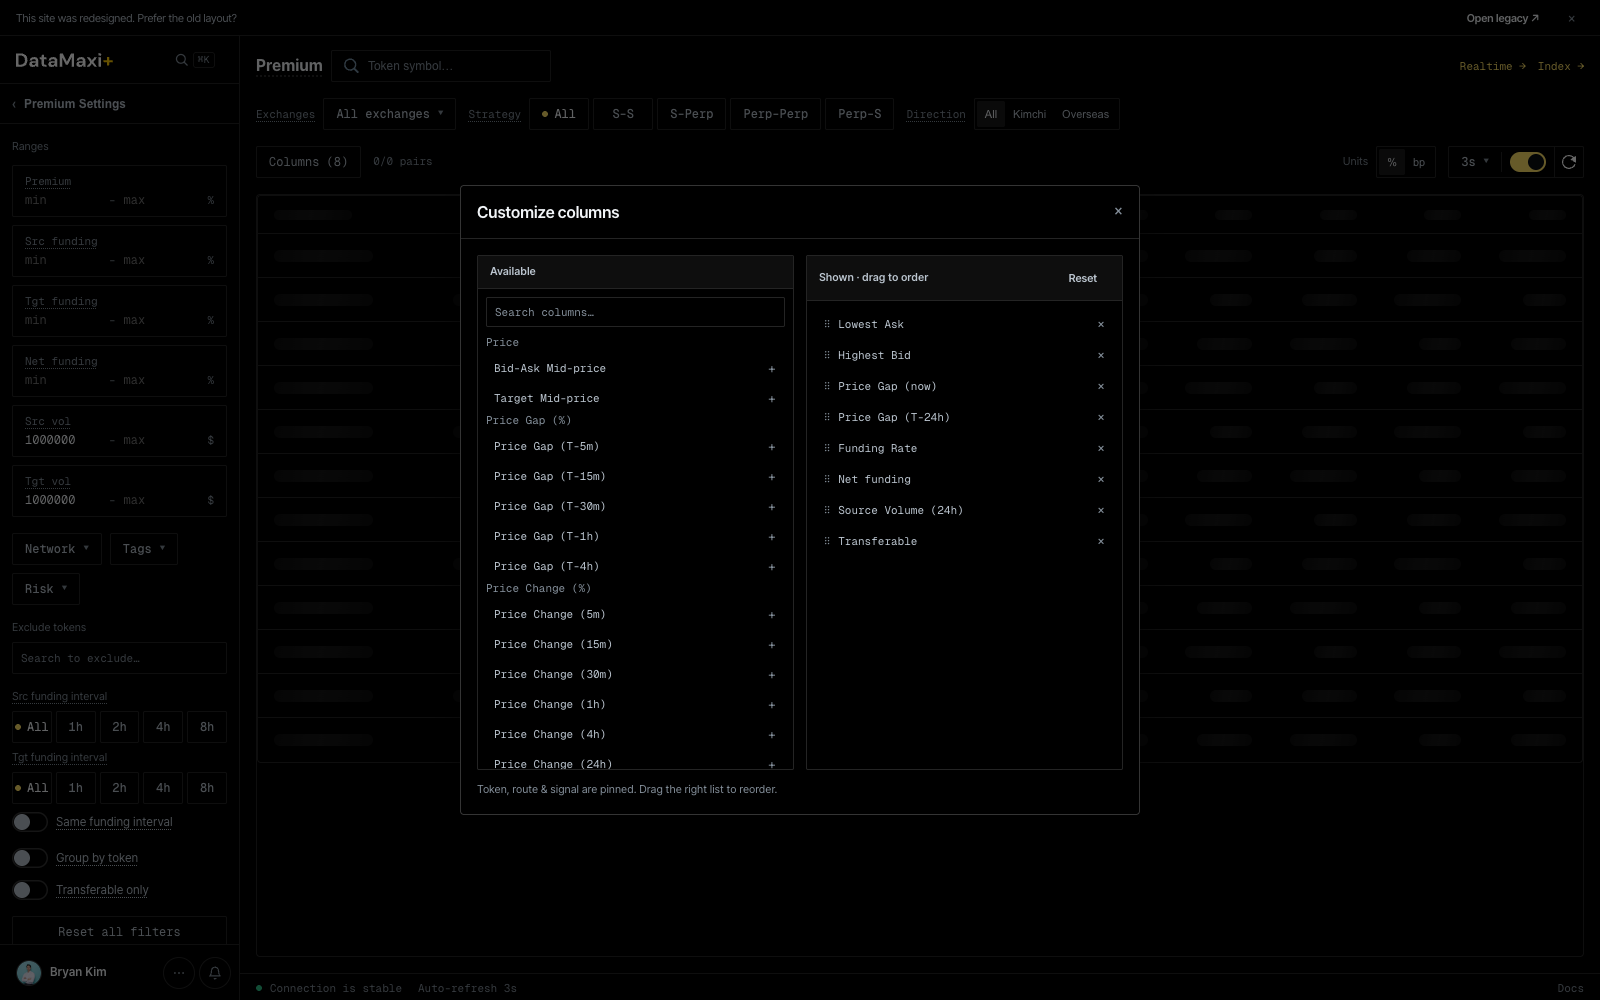
Two panes:
- Available (left) — every column the platform exposes, grouped by header (
Price,Price Gap (%),Price Change (%),Funding,Volume,Risk, …). Search filters the list.+adds the column to Shown. - Shown · drag to order (right) — the columns currently in the table, in order.
×removes; drag a row to reorder.Resetrestores defaults.
The status line at the bottom (Token, route & signal are pinned. Drag the right list to reorder.) confirms that the first three columns are pinned and can't be removed or reordered.
Global search palette
⌘K (macOS) / Ctrl+K (Windows / Linux) opens the global search palette from anywhere on the site — see the platform-wide entry below.
Global search palette
Available on every page via ⌘K / Ctrl+K.
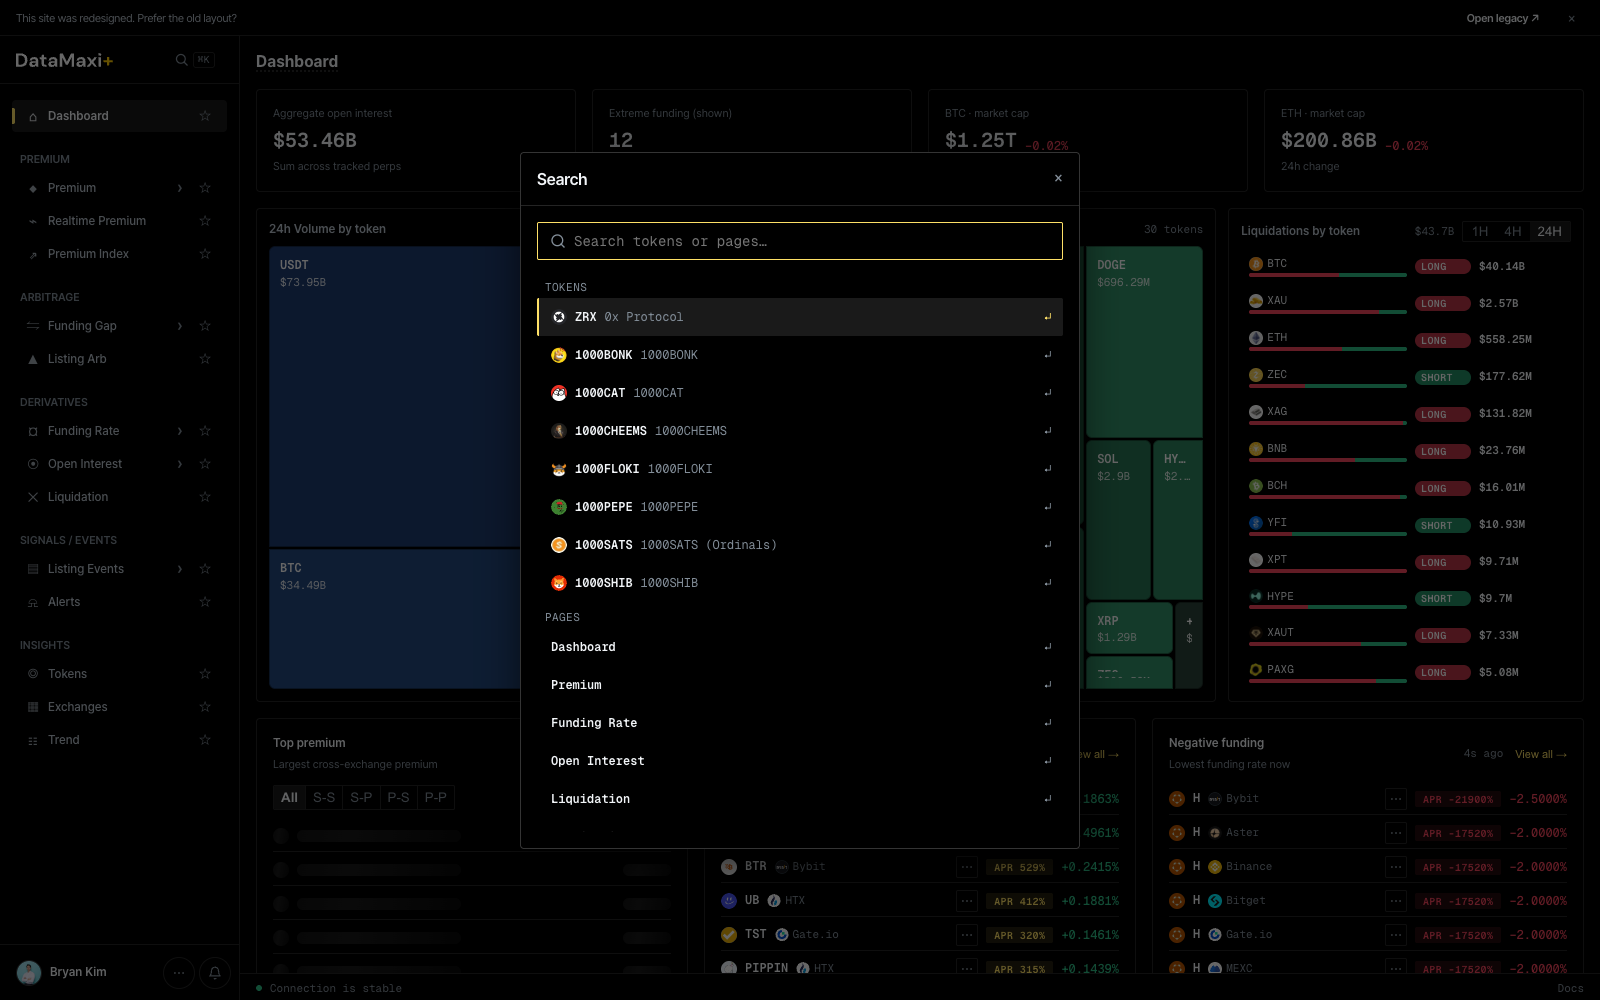
Two sections in the result list:
- TOKENS — fuzzy-matched against the full token catalog. Selecting a token jumps to
/token/<id>(see Tokens → Detail view). - PAGES — quick-jump shortcuts to every left-nav destination (
Dashboard,Premium,Funding Rate,Open Interest,Liquidation, …).
When to use this page
- You hold one of the assets and want to find an executable spread to cycle into the other venue.
- You're hunting Kimchi-direction premium with the KRW filter on.
- You're sanity-checking a strategy: turn
Transferable onlyon, set min volume on both sides, set min premium — what's left is what's actually tradeable right now.
Realtime Premium
A live matrix view of one token's premium across every venue, every leg — the picture you need when you're about to fire an order.
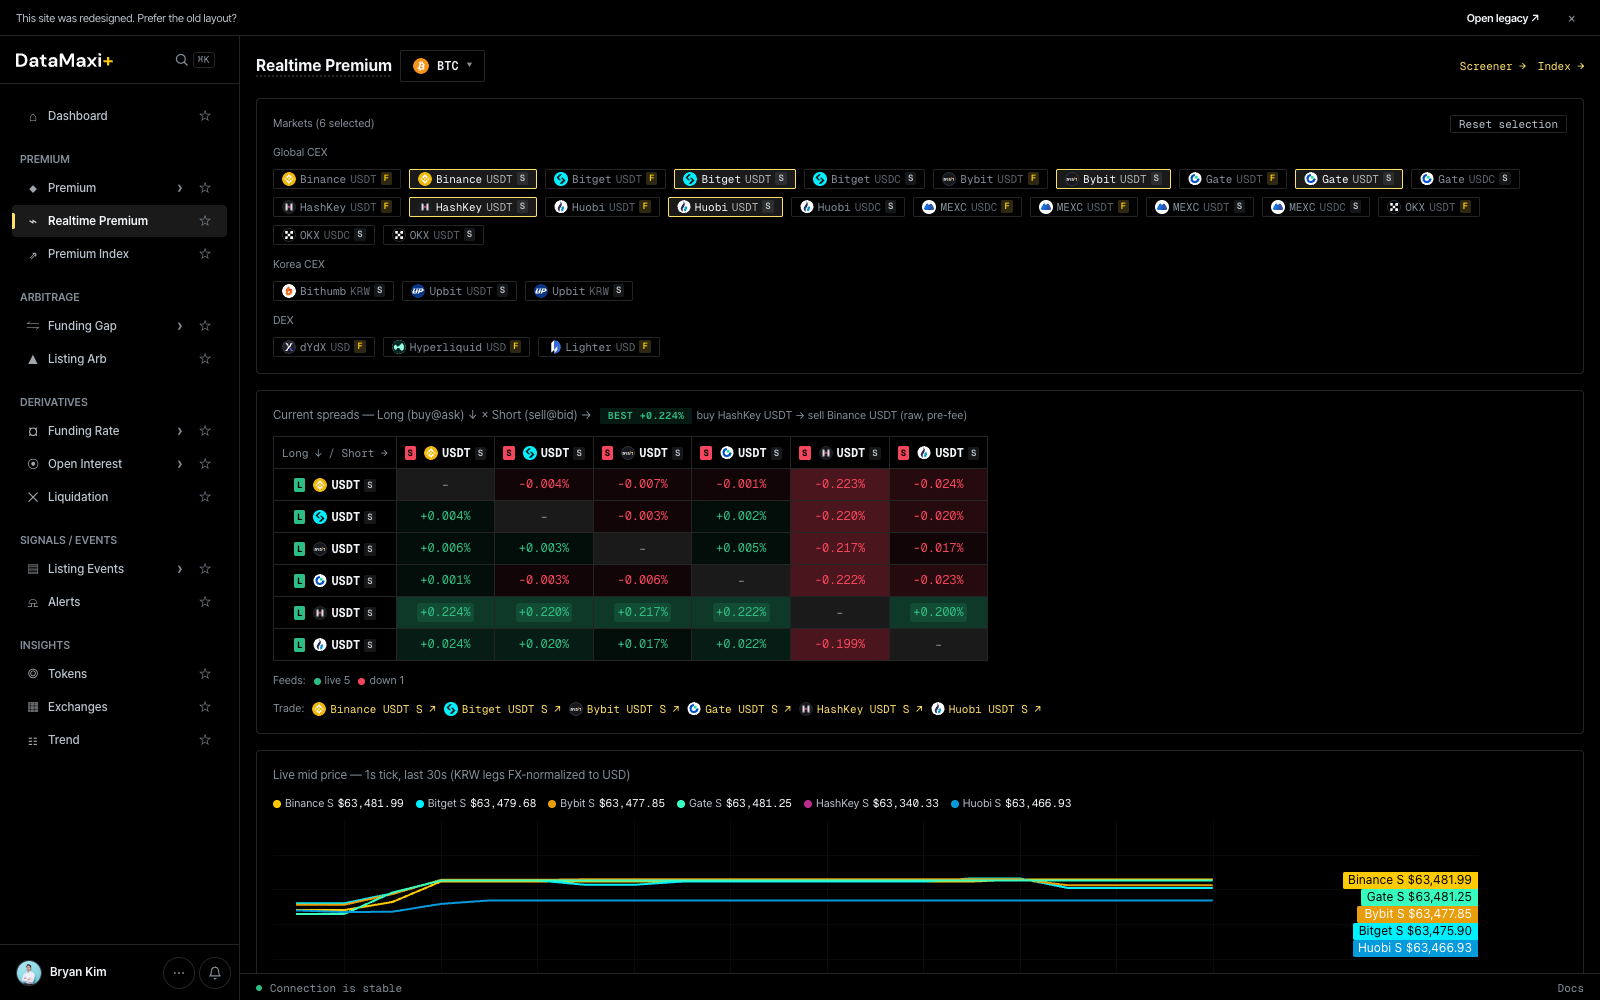
Token selector + jumps
- Token dropdown (top-left, default
BTC) — pick the base asset to inspect. - Screener → jumps back to the Premium screener.
- Index → jumps to the Premium Index history view.
Venue selection
A grid of venue chips lets you pick which markets to include in the matrix — both spot (USDT, USDC) and perp (USDTF, USDCF) variants per exchange:
BinanceUSDTF · BinanceUSDTS · BitgetUSDTF · BitgetUSDTS · BitgetUSDCS · BybitUSDTF · BybitUSDTS · GateUSDTF …
Reset selection clears them all.
The matrix
The center of the page is a Long ↓ / Short → matrix: rows are the leg you'd go long, columns are the leg you'd go short. Each cell shows the premium for that exact pair. Color encodes magnitude and sign — green when long/short pays, red when it costs.
This lets you read every executable directional pair for the selected token in one glance, instead of scrolling a long list.
Premium chart
Below the matrix, a history chart plots the selected pair's premium over time — useful for checking whether the spread is widening, mean-reverting, or has been at this level before.
Cell inspector
Unlike the row-inspectors on Premium / Funding Gap / etc., the Realtime Premium matrix uses a per-cell inspector. Clicking a cell pins it and surfaces a compact tooltip with the directional details and a tagged badge in the chart area.
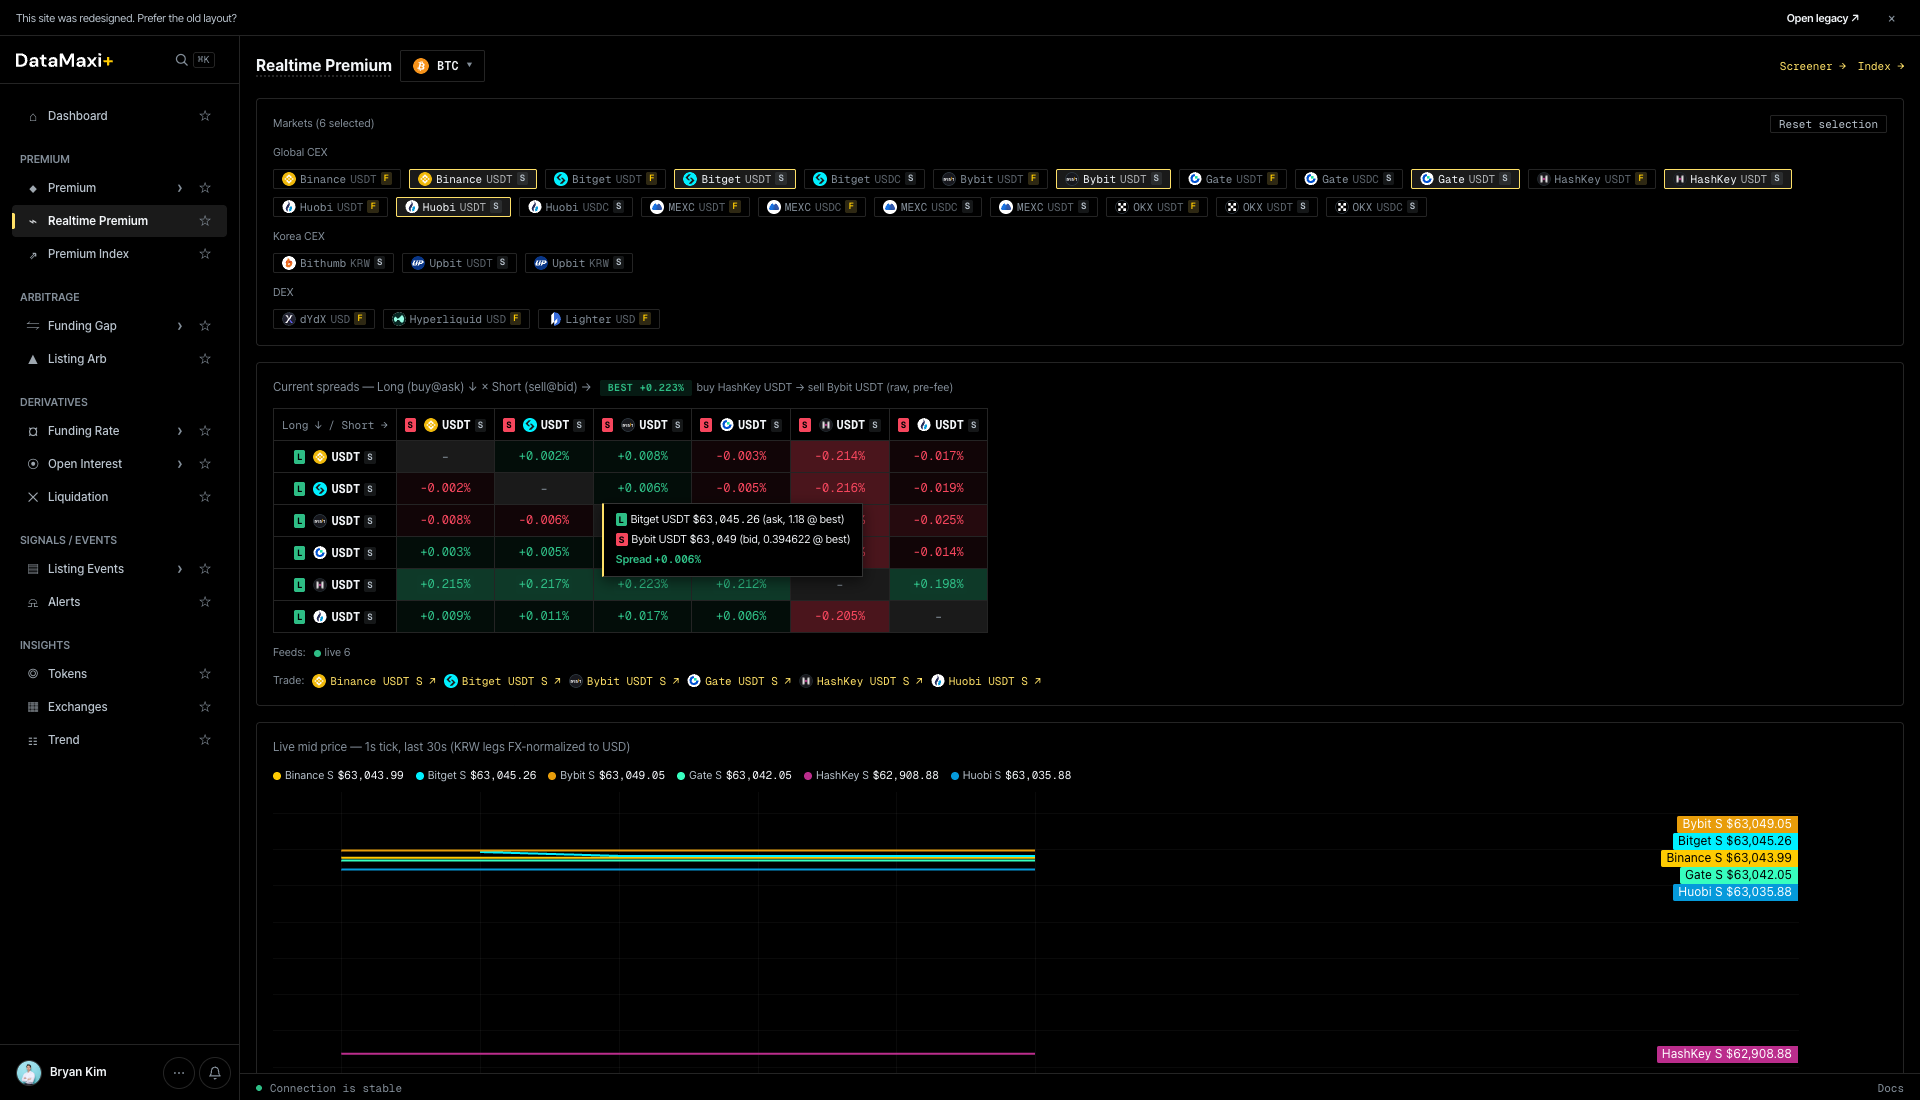
The tooltip shows:
- Direction — e.g.
Bingx USDT-M (NF) → BingX USD: 18.4 bps (-0.6 bps)reads as "go long BingX USDT-margined perp, short BingX USDC perp, premium is 18.4 bps". - As of timestamp — KST.
- Pin — keep this pair pinned in the chart legend below.
The lower history chart picks up the pinned pair(s) automatically — useful for confirming whether the spread is a one-print blip or a persistent regime.
When to use this page
- You've already picked a token (from Dashboard, Premium screener, or Alerts) and now need to choose the exact venue pair.
- You want a fast visual answer to "what's the cleanest direction to take?" without scrolling rows.
- You want to see whether the current spread is unusual versus the recent history.
Premium Index
The historical view of premium — a benchmark "index" that lets you see whether today's spread is normal, stretched, or off the charts.
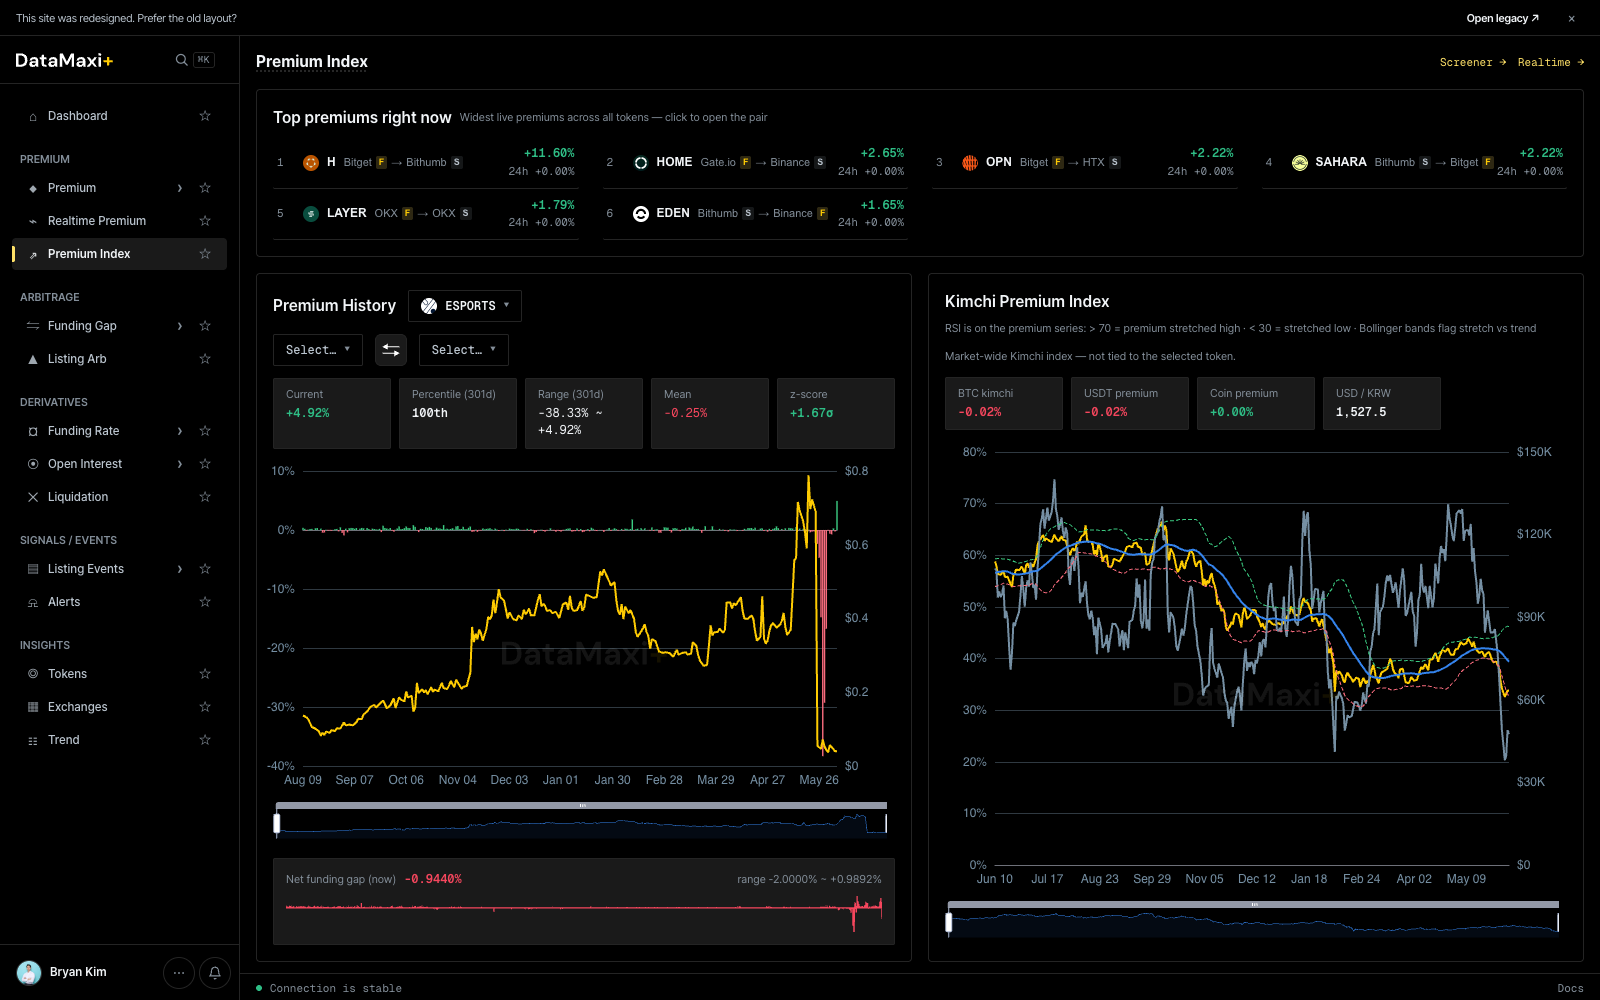
Top premium right now
Header strip with the highest premium pairs at this instant:
1  ESPORTS    BitgetF   →  BithumbS   +73.78%    24h  +0.00%
2  HOME       Gate.ioF  →  BybitS     +5.13%     24h  +0.00%
3  SAHARA     BithumbS  →  BitgetF    +2.07%     24h  +0.00%
4  币安人生    HTXS      →  HTXF       +1.41%     24h  +0.00%
5  LAYER      OKXF      →  OKXS       +1.39%     24h  +0.00%
…
Each row shows the token, the source leg, the target leg, the current spread, and the 24h change.
Screener → jumps back to Premium; Realtime → jumps to Realtime Premium.
Premium History (left chart)
Pick a token + leg pair from the dropdowns and the chart plots the spread over time. The export icon lets you pull the underlying series out for further analysis.
Kimchi Premium Index (right chart)
A dedicated history chart for KRW-market premium — the spread of Upbit/Bithumb prices vs the global mark. KRW pairs on Upbit and Bithumb still move markets harder than any other listing on the planet, so this index is a daily read for Korean-market traders.
When to use this page
- You want a context check: is the current spread on a token unusually wide, or is this its normal range?
- You're watching the Kimchi index as a market-temperature signal.
- You need to export a history series for backtesting or for your own dashboards.
Funding Gap
The screener for funding-rate arbitrage — long the venue paying funding, short the venue charging it, collect the gap as carry.
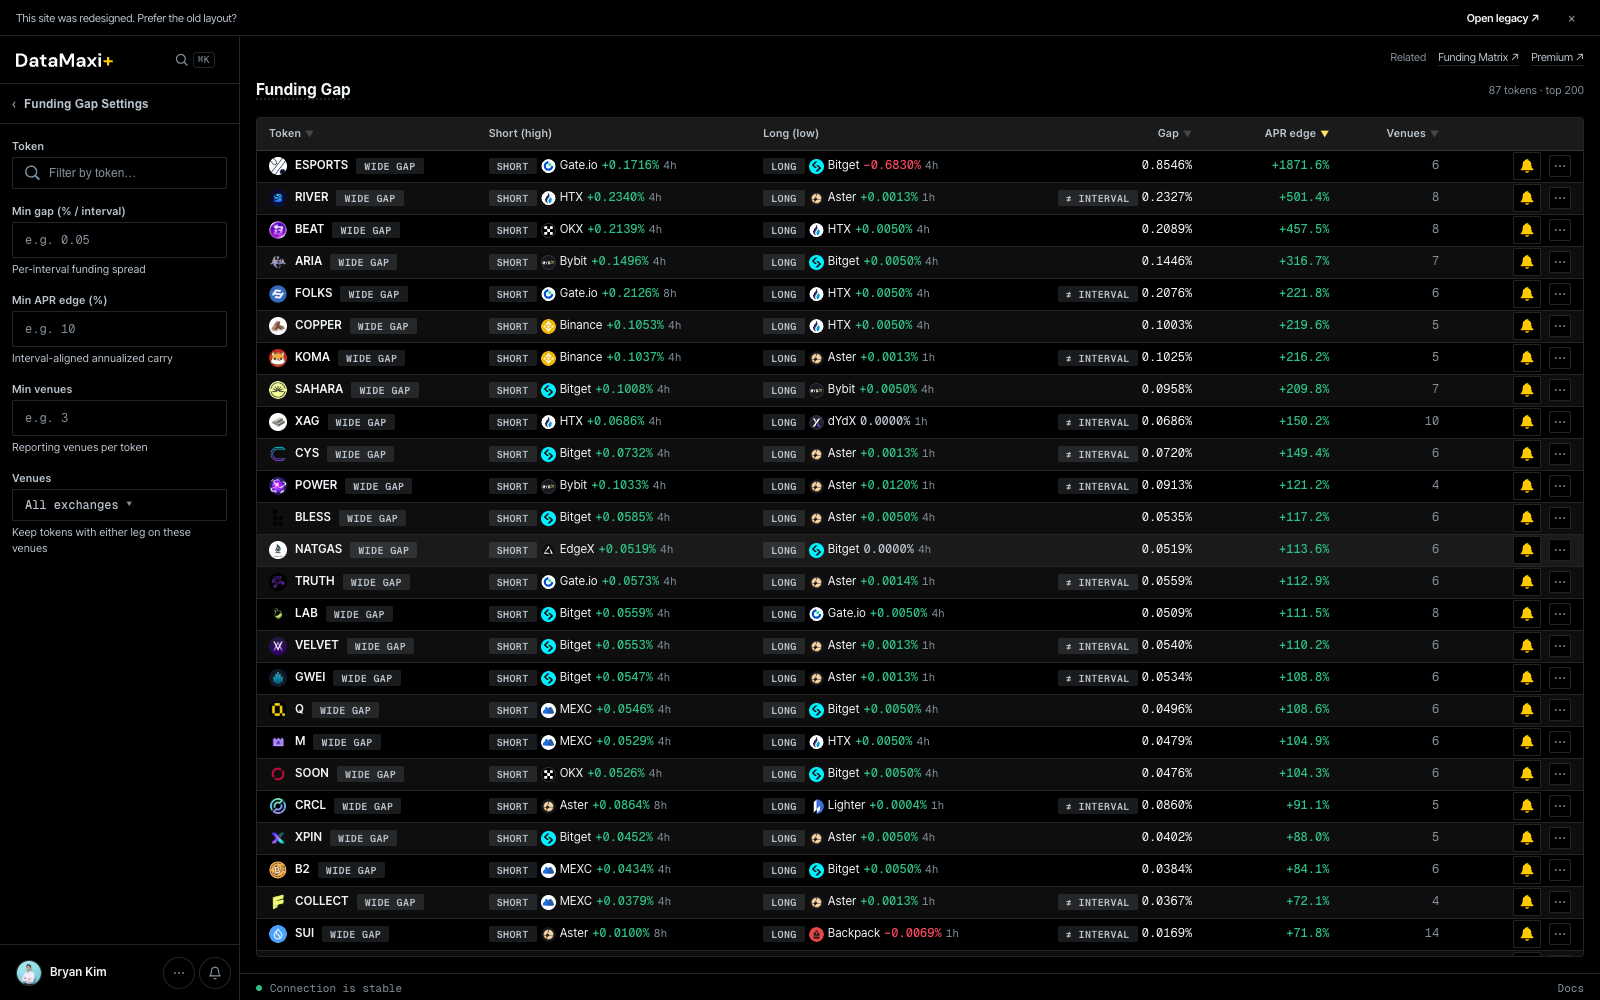
Header controls
- All exchanges ▼ — limit which venues are eligible to appear as a leg.
- The token-symbol search field above the table narrows to a single asset.
Funding Gap Settings (left rail)
Collapsible left rail with the same shape as Premium — set filter ranges once and reuse:
- Min gap — only show pairs where the funding-rate gap is at least this size.
- Min volume filters for each leg.
- Settlement interval filters (
1h / 2h / 4h / 8h) so you can match cycles between the two legs. - Risk and tag filters.
Main table
| Column | What it shows |
|---|---|
| Token ▼ | base asset |
| Short (high) | the venue + symbol you'd short (pays high funding) |
| Long (low) | the venue + symbol you'd go long (collects funding) |
| Gap ▼ | absolute difference in funding rate between the two legs |
| APR edge ▼ | gap annualized — the realistic carry edge once it's run over a year, before fees |
| Venues ▼ | the venue pair, with chain/tag chips |
Sort by APR edge to see the highest annualized carry. Sort by Gap for the rawest spread.
Inspector
Clicking any row opens a slide-out inspector on the right with the full per-venue funding distribution for that token, plus a side-by-side history chart that takes over the bottom half of the page.
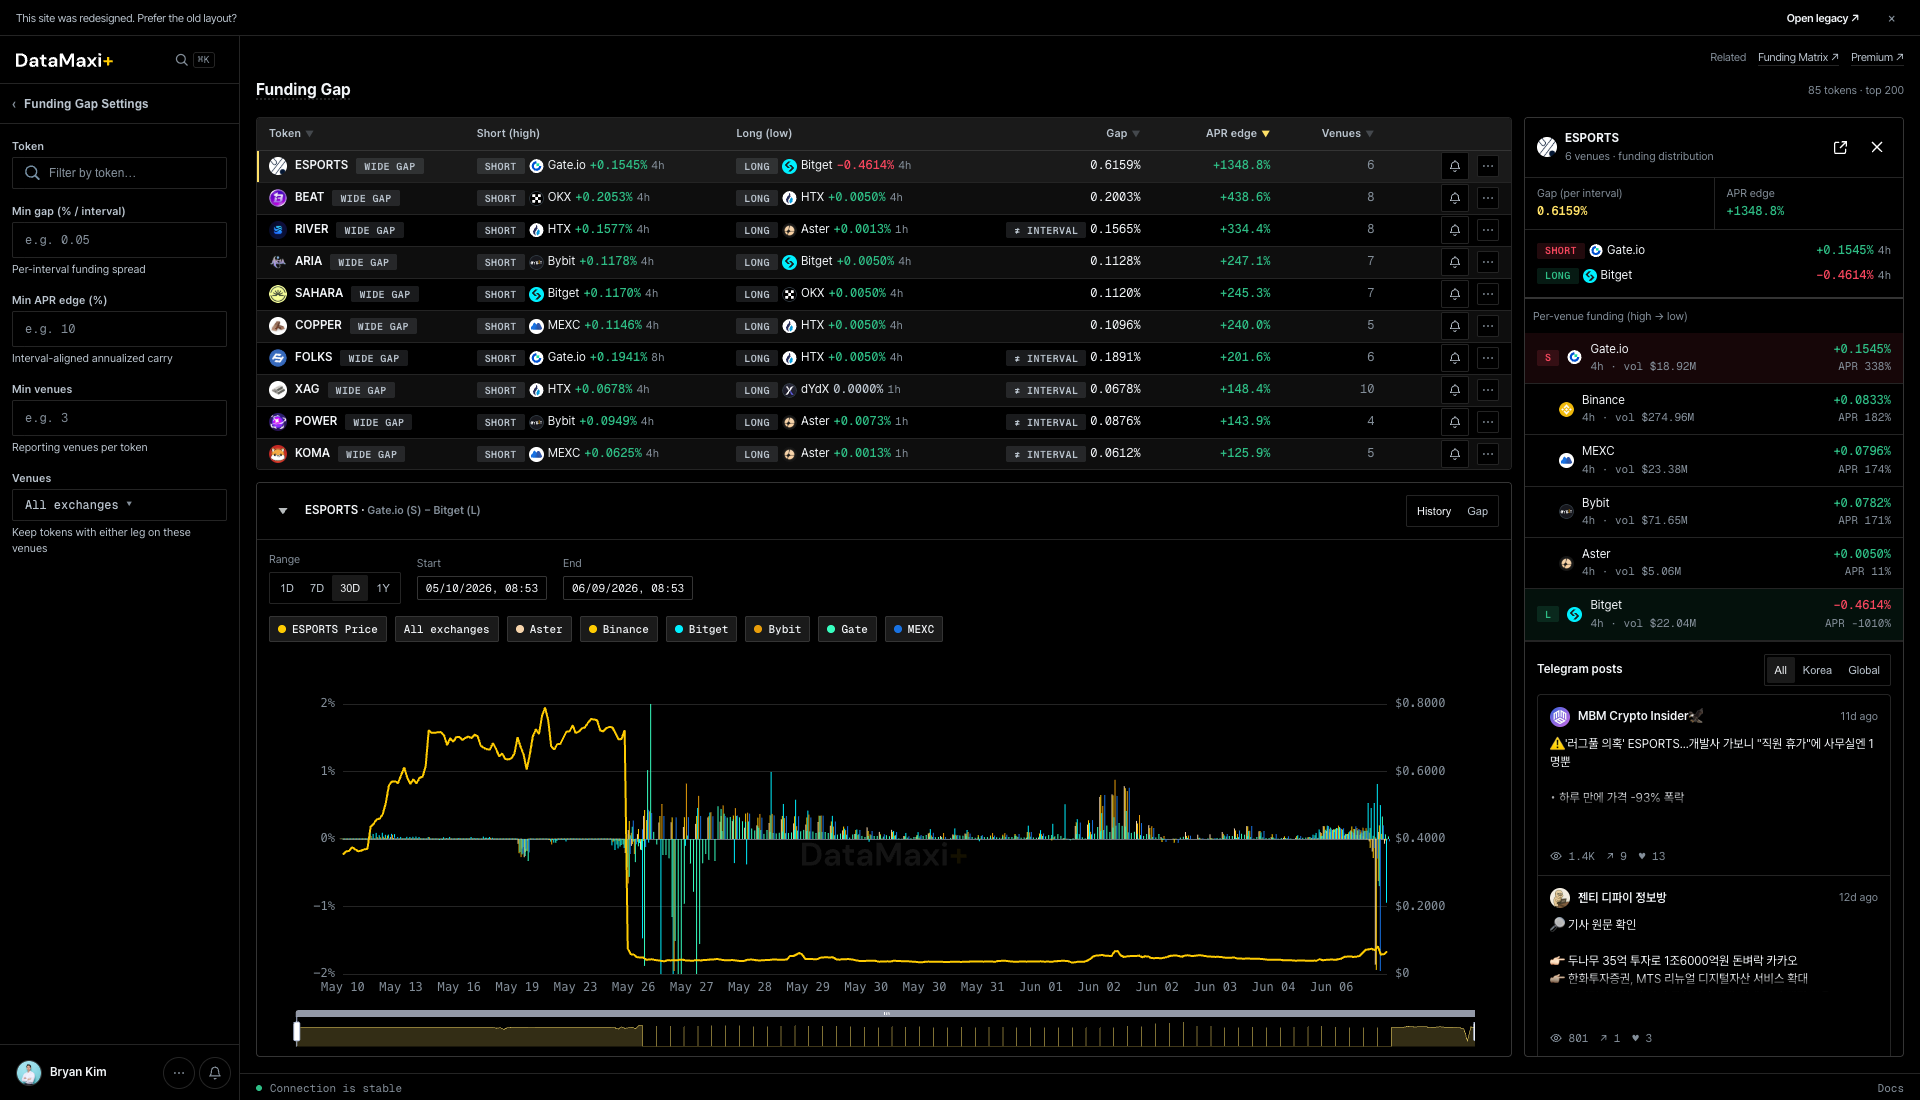
The panel itself, zoomed in:
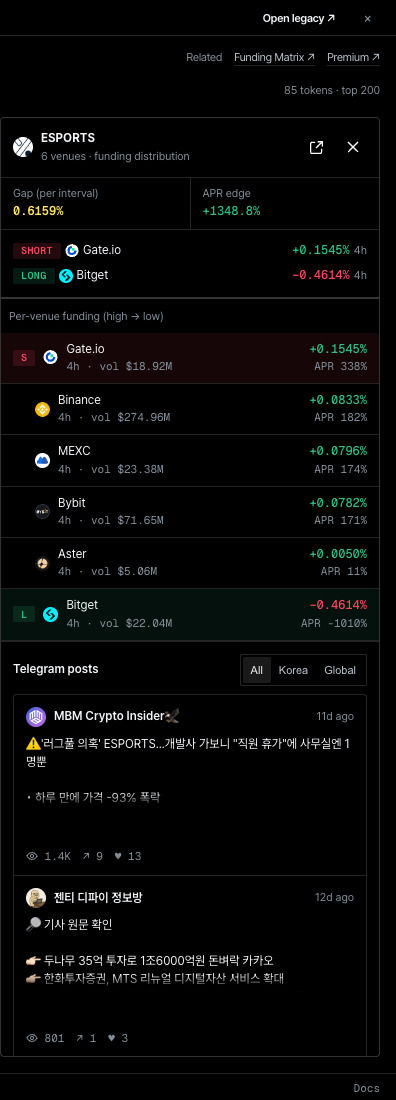
Panel header
- Token + venue count — e.g.
ESPORTS · 6 venues · funding distribution. - Top-right jumps:
Related · Funding Matrix →(jump to the Funding Rate grid for this token) andPremium →(jump to the Premium screener filtered to it). The counter85 tokens · top 200keeps you oriented within the surface.
Top stats
- Gap (per interval) — the absolute funding-rate gap on the chosen interval.
- APR edge — the same gap annualized. The realistic carry edge before fees.
SHORT / LONG legs
Two chips spell out the trade:
- SHORT — the venue + symbol you'd short (pays the high funding).
- LONG — the venue + symbol you'd go long (collects the funding).
Per-venue funding (high → low)
The full distribution, sorted from highest-paying to lowest. Each row:
- Venue glyph + name.
- Settlement interval (
4h) and 24h volume. - Current funding rate (
+0.1545%) and annualized APR (APR 338%).
The active SHORT leg sits at the top (red banding); the active LONG leg sits at the bottom (red banding for negative funding). Everything in between is candidate substitutes — useful when the primary venue is unavailable to you.
Funding history (bottom of main area)
When the inspector is open, the main area expands to show <TOKEN> rates (—) — 3h — a multi-line chart plotting the funding rate over time for each venue, color-keyed to the venue chips above. Use it to confirm the gap isn't a one-print outlier.
Telegram posts
Bottom of the panel: All / Korea / Global filter pills then a feed of recent Telegram mentions of the token.
When to use this page
- You want delta-neutral carry — pair the long-funding leg with the short-funding leg, hold, collect.
- You want to know which tokens are currently regime-paying so you can rotate into them.
- You want to spot venue funding outliers (one exchange is paying way more than the others).
See also the funding-rate-arb strategy playbook for the full setup.
Listing Arb
The screener for listing arbitrage — KRW-market listing events on Upbit and Bithumb that open at a premium to the global price, plus their historical analogues.
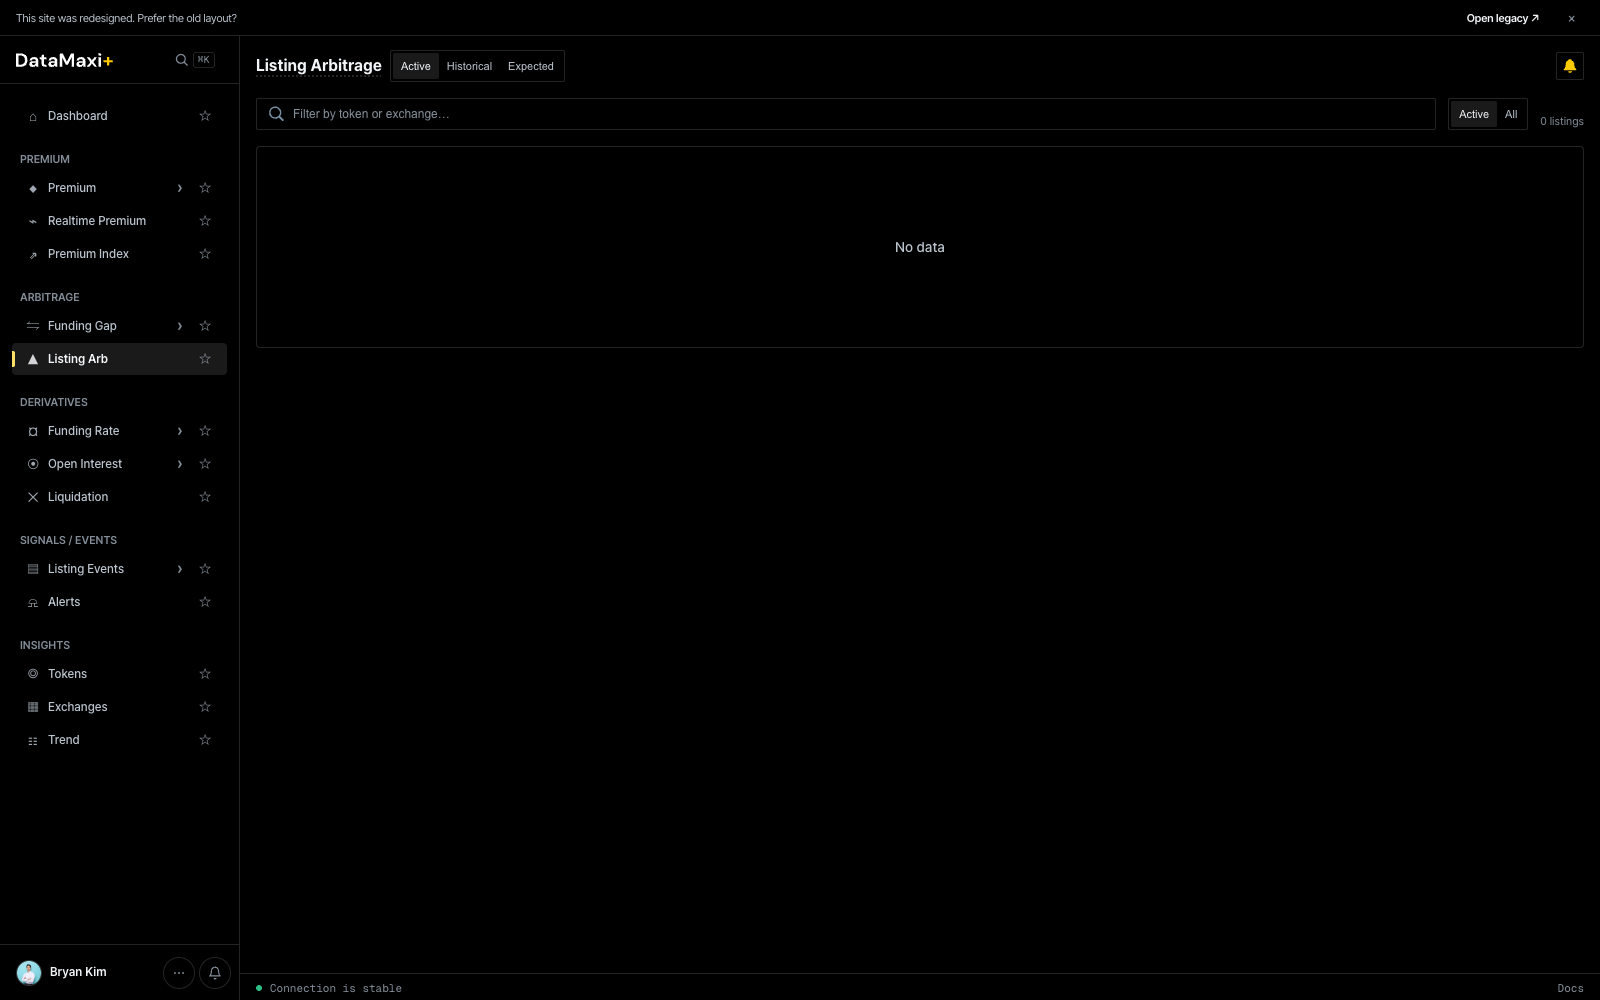
Status tabs
Three top-level tabs along the page title:
- Active — listings currently open and tradeable. Premium is live.
- Historical — past listings; useful for sizing the typical edge and the typical reversion window.
- Expected — listings that haven't gone live yet (scheduled or strongly-signalled), so you can pre-position.
Filter bar
- Search — filter by token or exchange.
- Active / All toggle on the right — narrow to active-only or include all matching the tab.
What you see in a row
Each active listing surfaces:
- Token + KRW-market venue (Upbit / Bithumb).
- Global mark (the reference price on a non-Korean venue).
- KRW-market price + premium %.
- Time since listing.
- Volume on both legs.
When the Active tab shows No data, there are no live KRW-market listings open right now — that's normal between events.
Historical tab
Historical opens the post-mortem view — every past KRW-market listing the platform has tracked, ranked by the post-listing move.
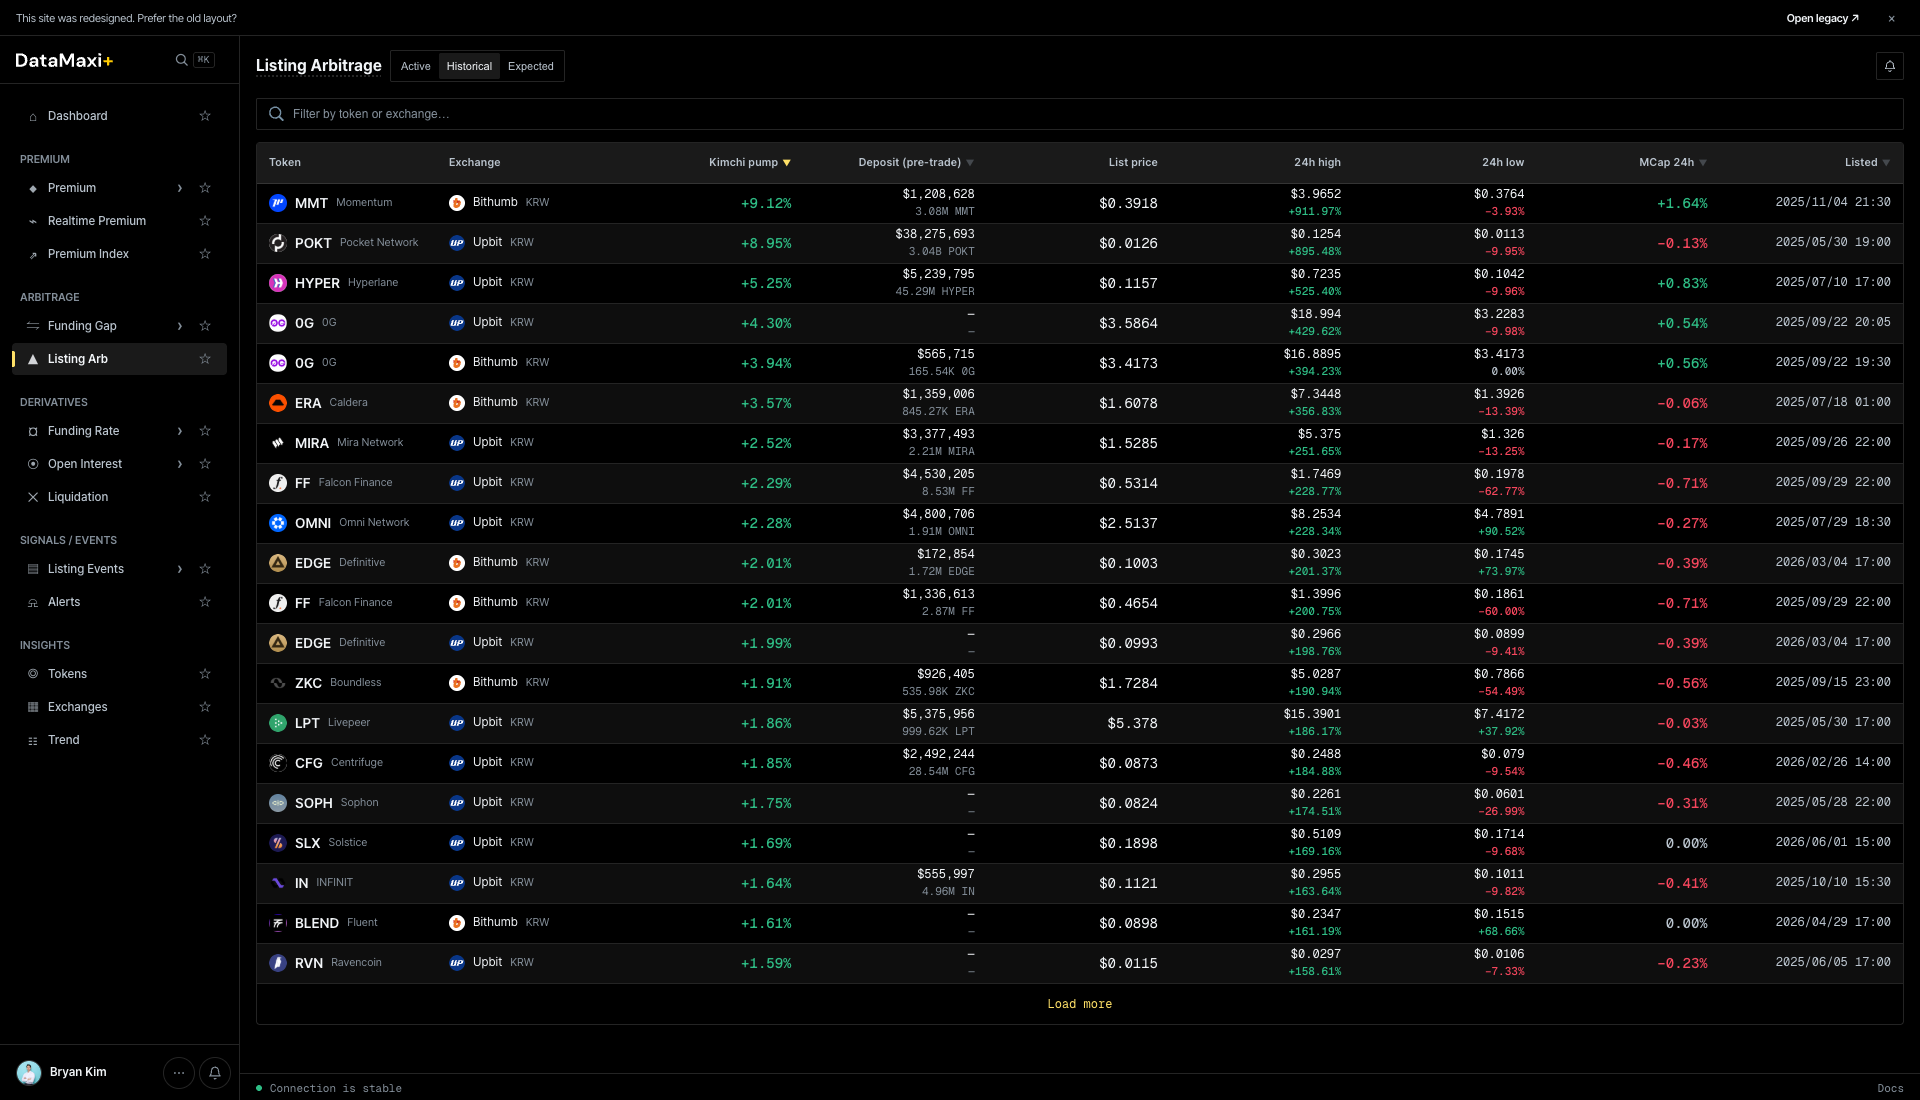
Columns:
| Column | What it shows |
|---|---|
| Token | base asset |
| Exchange | KRW-market venue (Upbit / Bithumb) |
| Wick gain ▼ | the largest premium reached during the post-listing window |
| Deposit (pre-open) | on-chain hot-wallet deposit volume detected before trading opened — the leading signal of "scale of attention" |
| List price | KRW open price |
| 24h high | KRW high in the first 24h |
| 24h low | KRW low |
| +15m / +1h / +24h ATL | price relative to listing benchmark at +15min, +1h, +24h all-time-low |
| Listed | date / time |
Use it to size what's normal — typical wick-gain range, how much deposit-volume precedes the bigger moves, how fast the price retraces.
Historical detail page
Clicking any historical row navigates to /listing-arbitrage/<venue>-<symbol> — a per-event post-mortem.
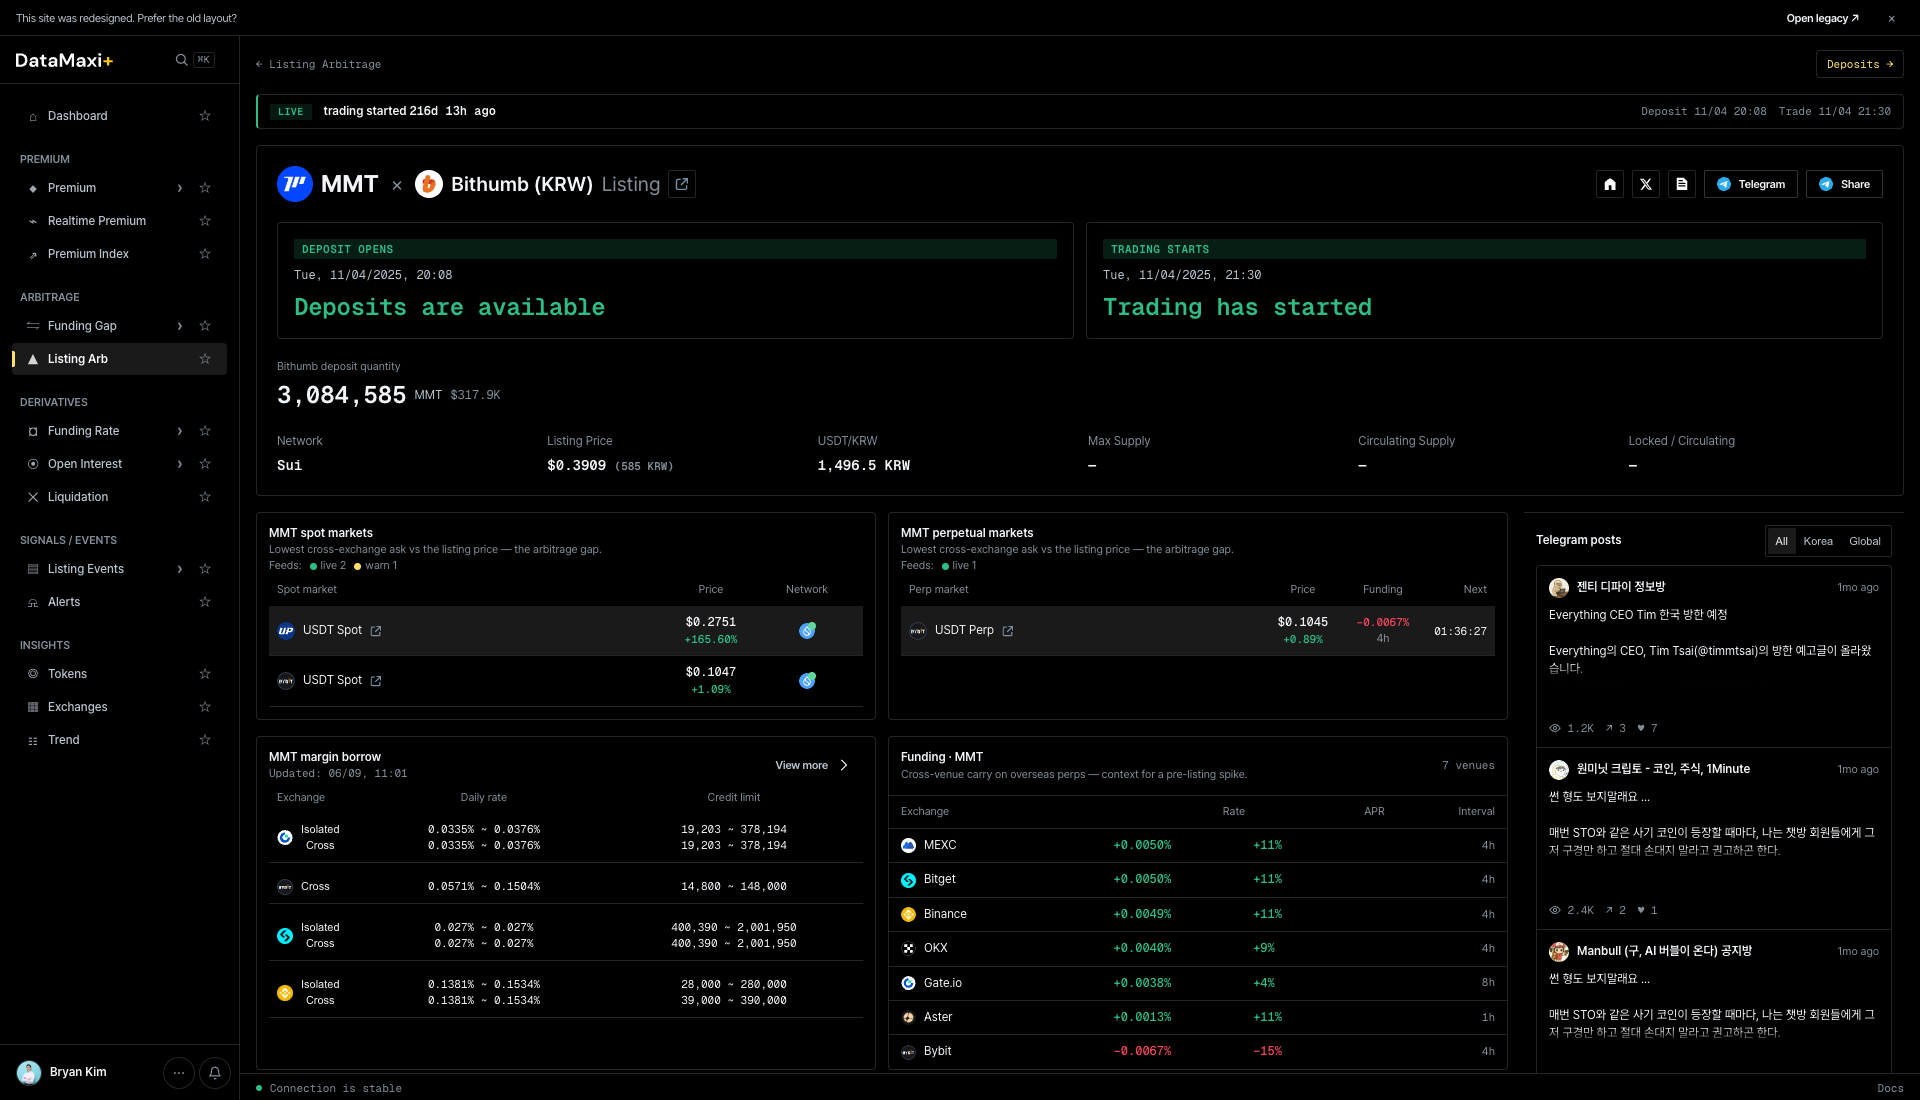
The detail page has:
- Header — token + KRW-market chip +
Listingchip + time-since. - Status cards —
DEPOSIT STATUS · Deposits are availableandTRADING STATUS · Trading has started. The chips tell you whether withdrawals from the KRW venue and trading are currently open. - Headline numbers — KRW open / Listing Price (perp anchor) / USD Price / Circulating supply / Listed at.
- MMT spot markets + MMT perpetual markets — venue-by-venue list of where the token now trades + price + volume.
- MMT margin lanes — which venues support margin trading for the token.
- Funding (4h) — cross-venue funding-rate strip for the token.
- Telegram posts — recent Telegram mentions, with All / Korea / Global filter.
Expected tab
Expected shows listings that haven't gone live yet — scheduled, hinted, or signal-detected — so you can stage keys, balances, and bots before the announcement lands.
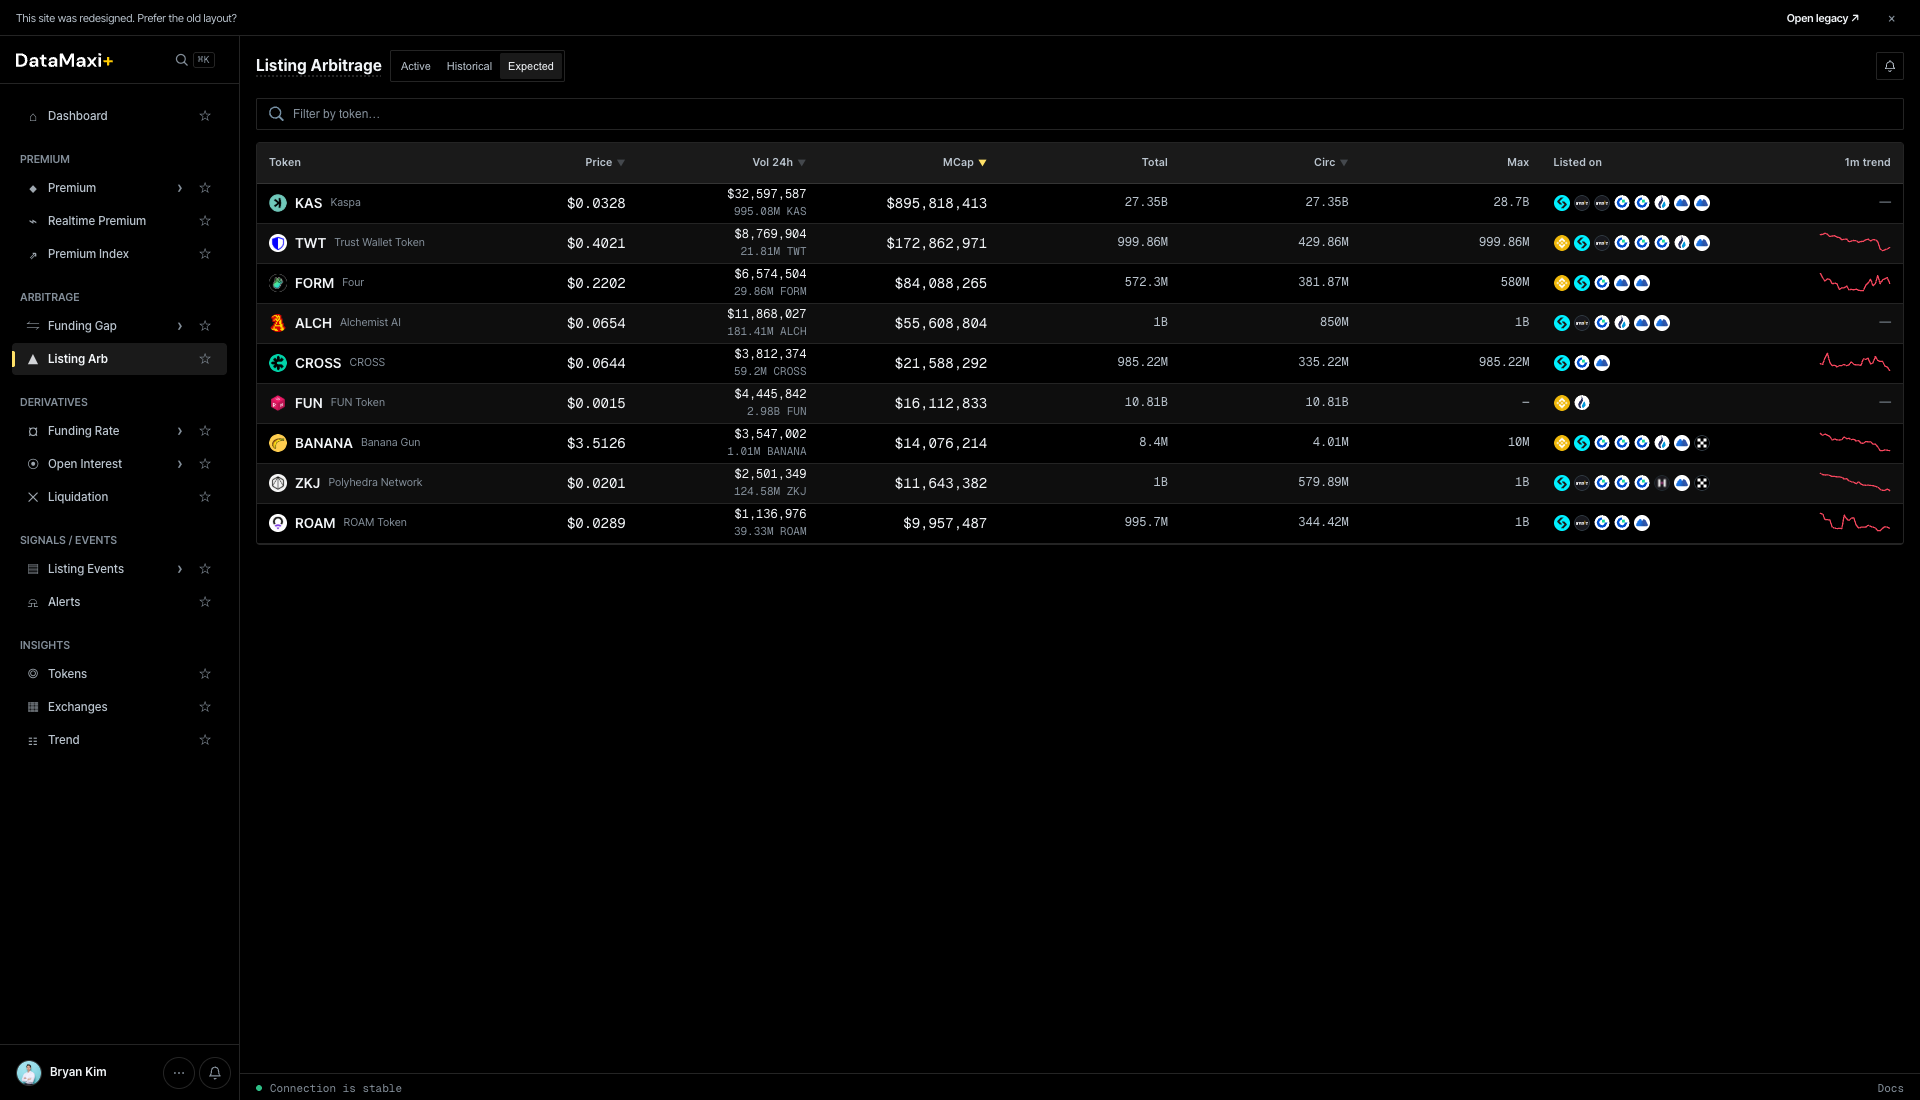
Columns: Token · Price · Vol 24h · MCap · Total · Circ · Max · Listed on · 1m trend.
Listed on is the chip strip of venues that already list the asset — useful for pre-trade liquidity sizing on the global leg. 1m trend is a sparkline.
When to use this page
- You're running the listing-arb playbook and want to see live KRW-market premium right when it opens.
- You're studying past events — what's the typical premium curve, how long does it stay open, what's the dump risk.
- You want a heads-up on Expected events so you can have keys, balances, and bots staged before the announcement lands.
See Strategies → Listing Arbitrage for the full playbook including risk caveats (KRW deposit windows, Upbit's 유의종목 caution flags, etc.).
Funding Rate
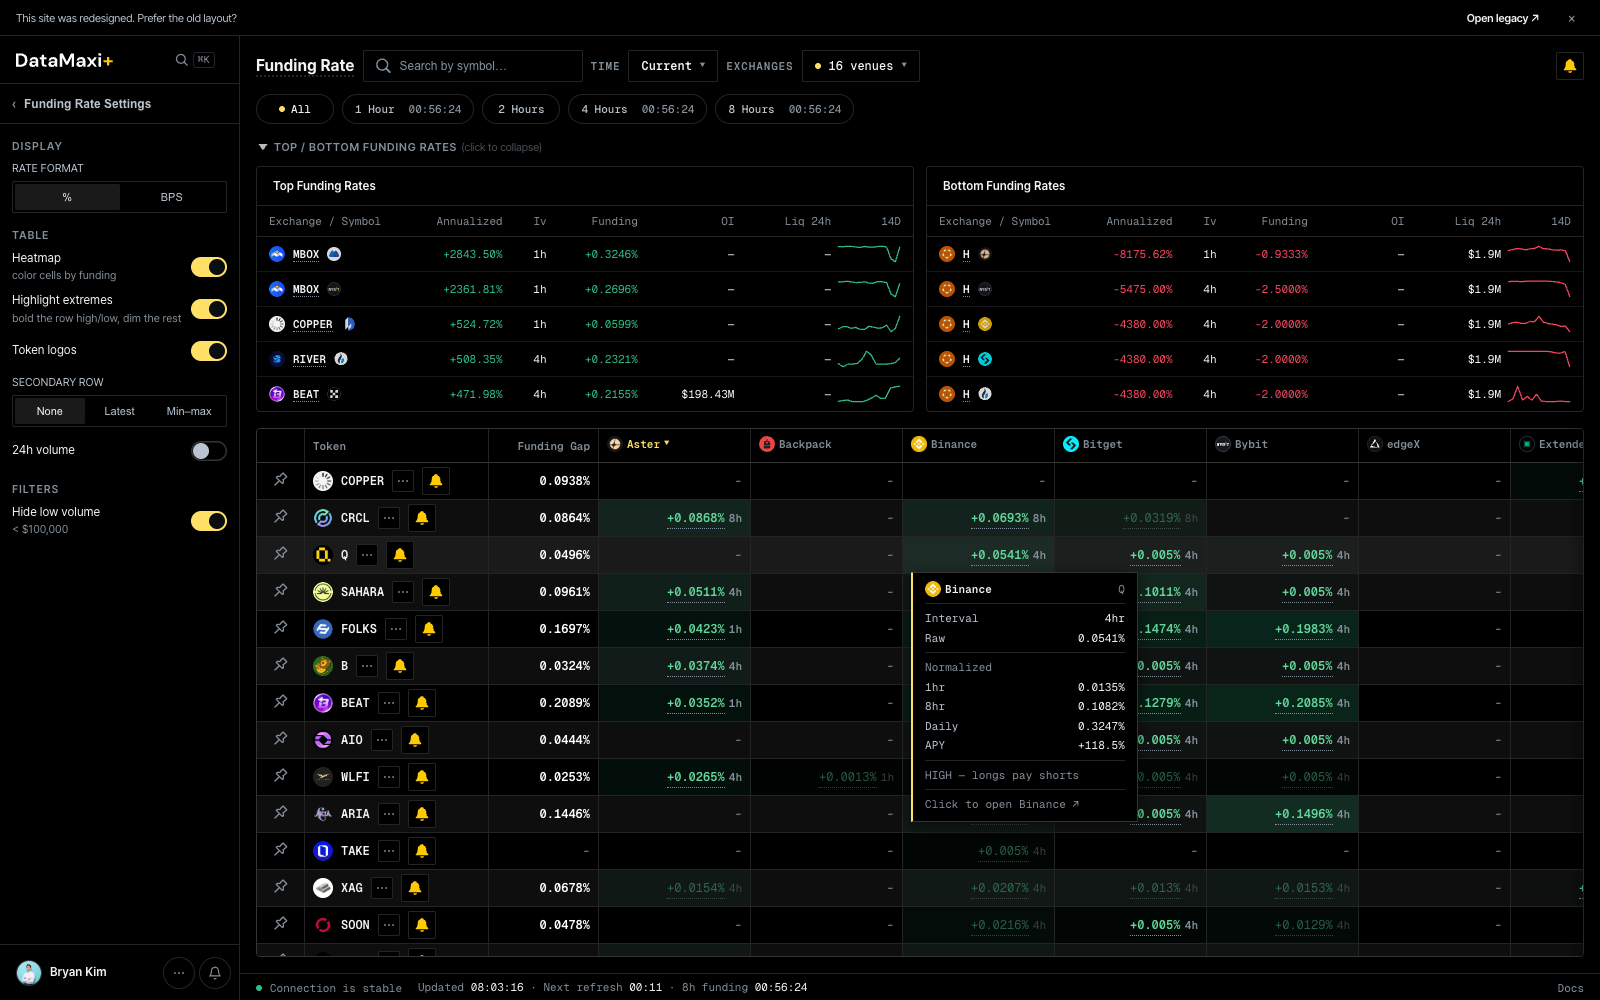
A full cross-venue funding-rate grid — one row per token, one column per venue, color-coded by sign and magnitude.
Header controls
- Time pill —
Current ▼/ historical snapshot pickers. - Venue pill —
16 venues ▼to toggle which exchanges appear as columns. Current venue set spans the major perp venues (Aster, Backpack, Binance, Bitget, Bybit, edgeX, Extended, Gate, HTX, HashKey Global, Hyperliquid, KBit, Lighter, and others).
Funding Rate Settings (left rail)
- Display unit —
BPS(basis points) vs%. - Highlight outliers — toggle that emphasizes cells that diverge from the row median.
- Cell content —
None / Latest / Min–maxswitches what's drawn in each grid cell. - Hide low volume — drops rows where every venue's volume is below a threshold.
Reference cards (top of grid)
Two strips of cards above the main grid:
- Top Funding Rates — tokens currently paying the most positive funding.
- Bottom Funding Rates — tokens currently most negative.
Each card shows the token, the venue, the rate, and a small sparkline.
Main grid
| Column | What it shows |
|---|---|
| Token | base asset |
| Funding Gap | per-row max minus min — the spread you could collect with a long-low / short-high pair |
| One column per venue | latest funding rate on that venue's perp for this token |
Sort by Funding Gap to surface the biggest carry edges instantly.
Inspector
Clicking any cell in the grid (or the row's leftmost token cell) opens a slide-out inspector for the selected token, and expands the main area to show a venue-by-venue funding-rate history chart.
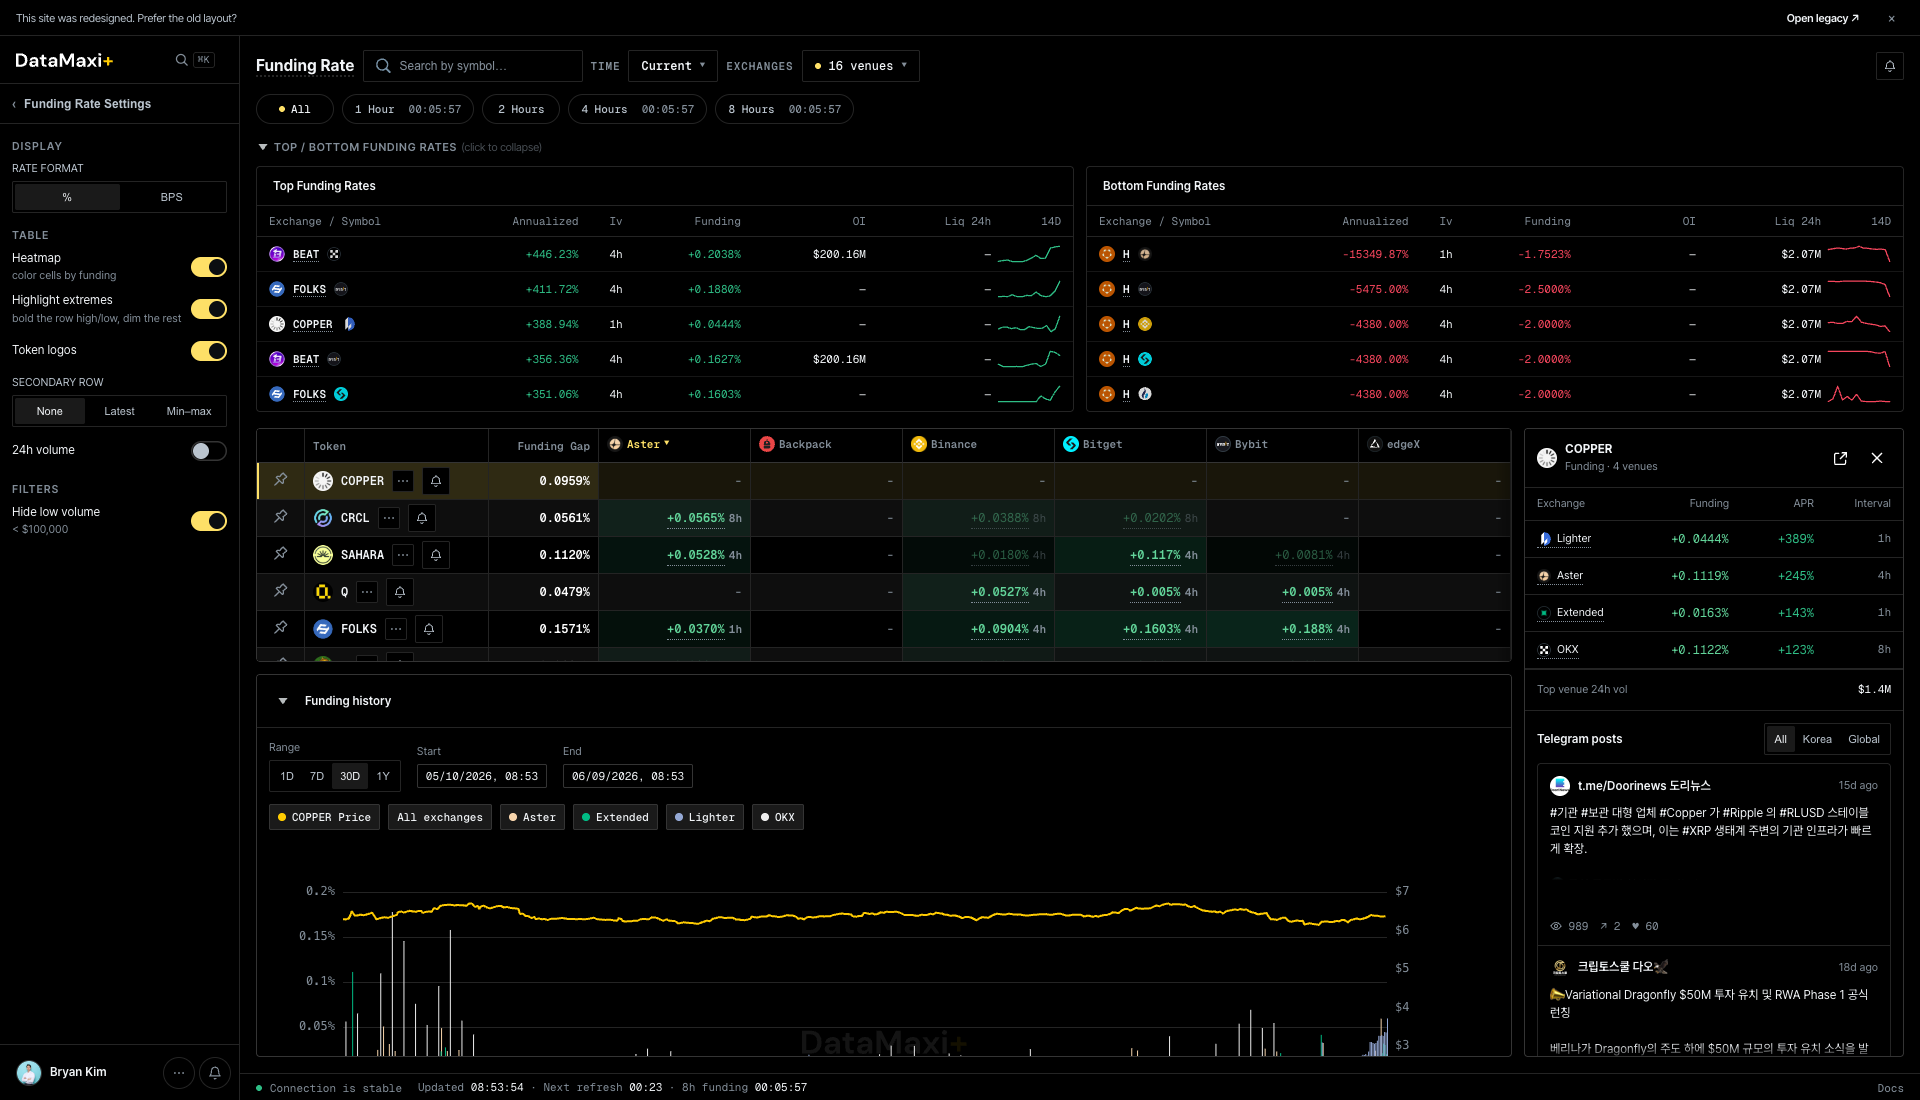
The panel itself, zoomed in:
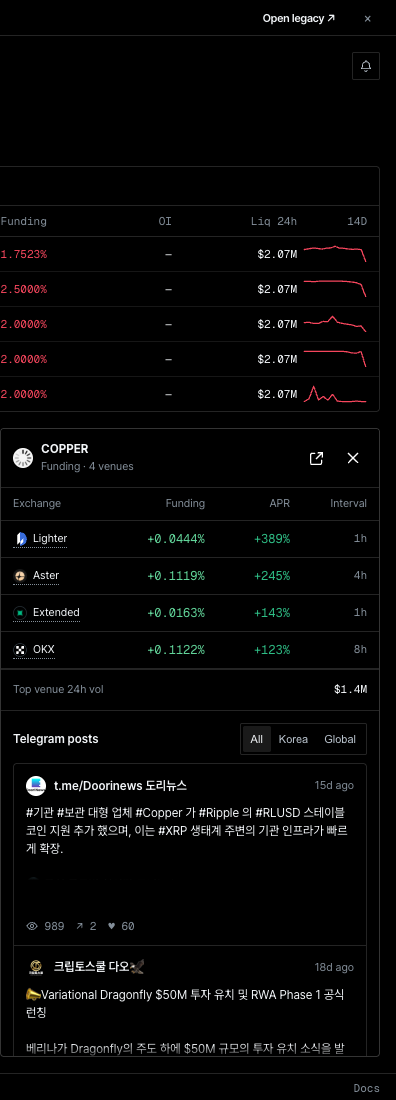
Panel header
- Token symbol with current price.
- Quick action links to the related screens.
Per-venue current rates
Cards laid out vertically — one per venue in scope — each showing the current funding rate, the settlement interval, and a small sparkline for context. Color-coded the same way as the grid (green = paying, red = collecting).
Funding history (bottom of main area)
The main area expands underneath the grid into a Funding history time-series. Use the venue chips above the chart to add or remove series (Aster, edgeX, Extended, Lighter, …), and the time-range selectors above the legend to choose 24H / 7D / 30D.
Telegram posts
Same shape as the other inspectors — All / Korea / Global filter, then a feed of token-tagged Telegram mentions.
When to use this page
- You want a bird's-eye view of where the funding regime is right now, not just the extremes.
- You're rebalancing a carry book and want to compare candidates side-by-side.
- You're scanning for divergence — a single venue paying much more than the rest can be an opportunity (or a warning).
Open Interest
Cross-venue perp open interest in two complementary layouts: an aggregate market overview and a token×venue matrix.
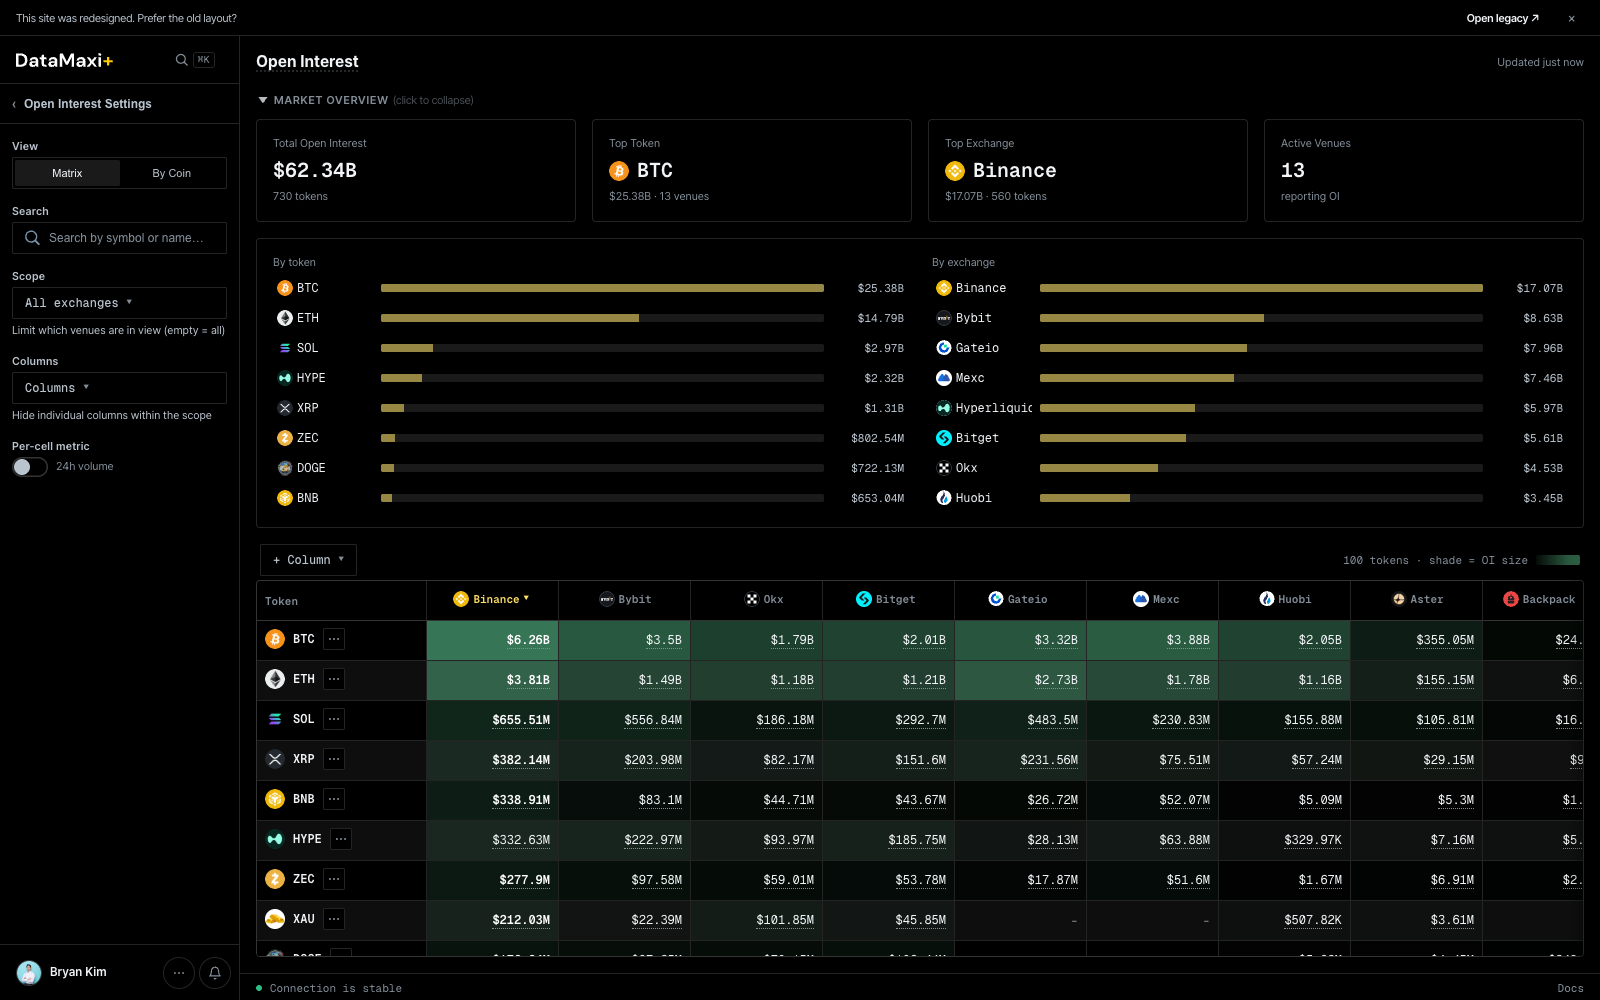
Market overview (top)
A collapsible header strip with the headline numbers:
- Total OI in dollars (e.g.
$31.47B). - Per-token cards for the biggest names (BTC, ETH, …).
- Per-venue cards for the biggest venues (Binance, …).
- Aggregated counts and a horizontal-bar view of the share each holds.
Layout toggle
Two view modes for the main grid:
- Matrix — one row per token, one column per venue, cell = OI in dollars. Best for comparing the same token across venues.
- By Coin — pivot the other way, focused on a single token.
Header controls
- All exchanges ▼ — pick which venues to include as columns.
- Columns ▼ — show / hide specific venues. Each column header has a
▼ ✕so you can prune the matrix down to just the venues you trade. - Hide low volume (in the left rail's Open Interest Settings) — drop rows that aren't worth attention.
Per-cell color encoding
Each matrix cell is colored by its share of the row total — darker green means that venue carries a larger fraction of the token's OI. A $ token concentrated on one venue stands out instantly.
Inspector
Clicking any token row opens a slide-out inspector with the per-venue OI breakdown for that token, and replaces the main area with a stacked open-interest history chart.
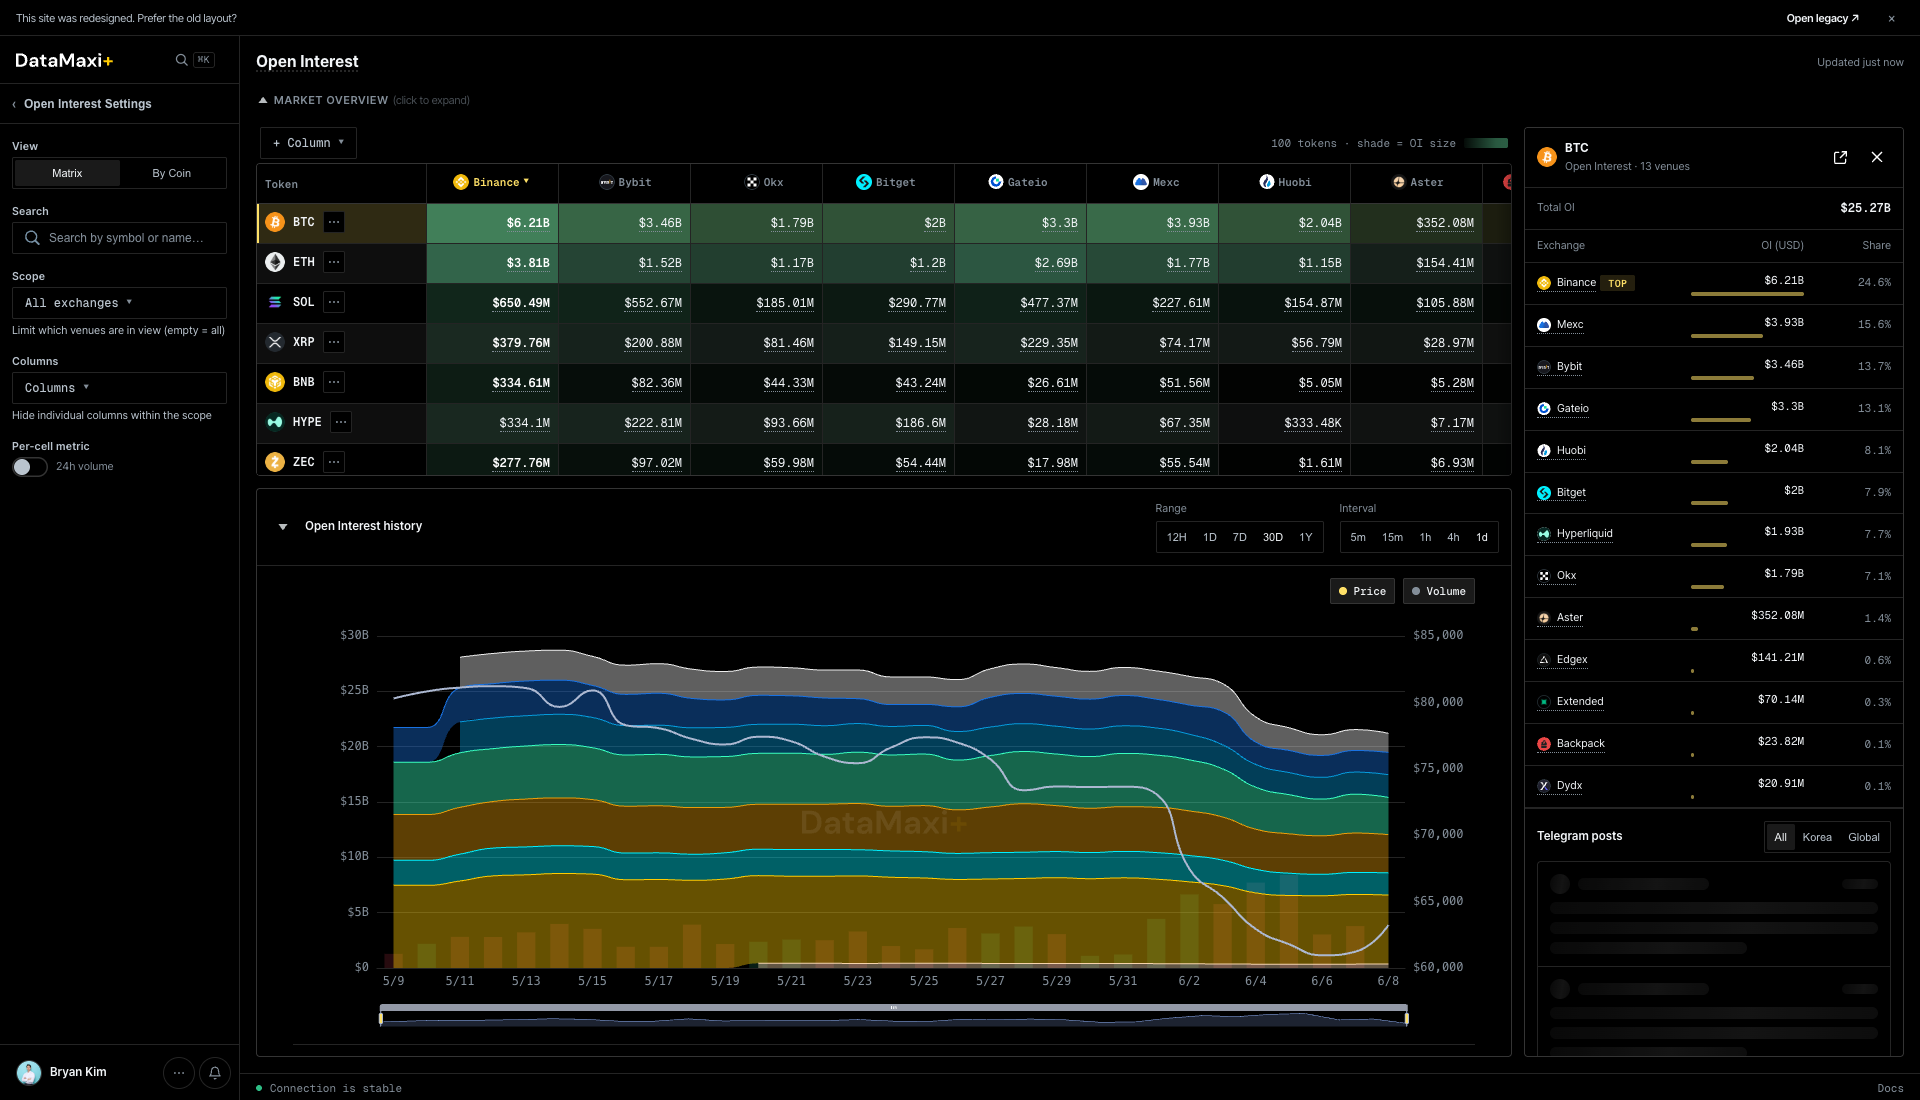
The panel itself, zoomed in:
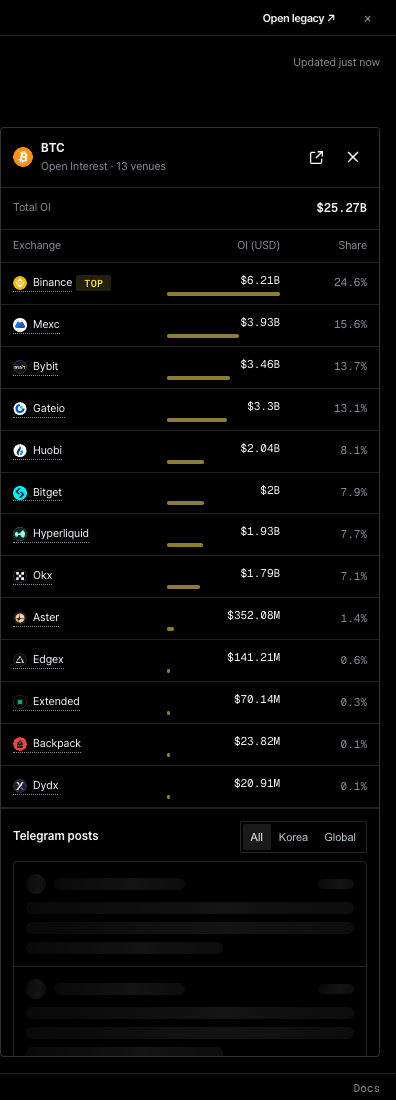
Panel header
- Token symbol + total OI (USD).
- Close and external-link controls.
Per-venue OI breakdown
Compact list of every venue holding OI in this token. Each row shows the venue glyph + name + OI in dollars + 24h delta. Sorted from highest to lowest holding.
Open interest history (main area)
A stacked-area chart colored by venue — Binance / Bybit / OKX / Bitget / Gate.io / MEXC / Hyperliquid / Aster / Backpack / Extended, etc. Drag the time-range slider beneath the chart to zoom in on a specific window. The stack lets you see at a glance which venue's OI is growing or shrinking relative to the others — a tell for capital rotation between exchanges.
Telegram posts
Bottom of the panel: same Telegram feed format as the other inspectors.
When to use this page
- Pre-trade context check: "where does the OI actually live on this token?"
- Venue-risk read: a single venue carrying the majority of OI is a concentration risk on long-tail tokens.
- Trend spotting: rotate the time pickers and watch where new OI is flowing.
Liquidation
The live liquidation feed plus a market-overview header — see liquidations as they hit, and read the regime at a glance.
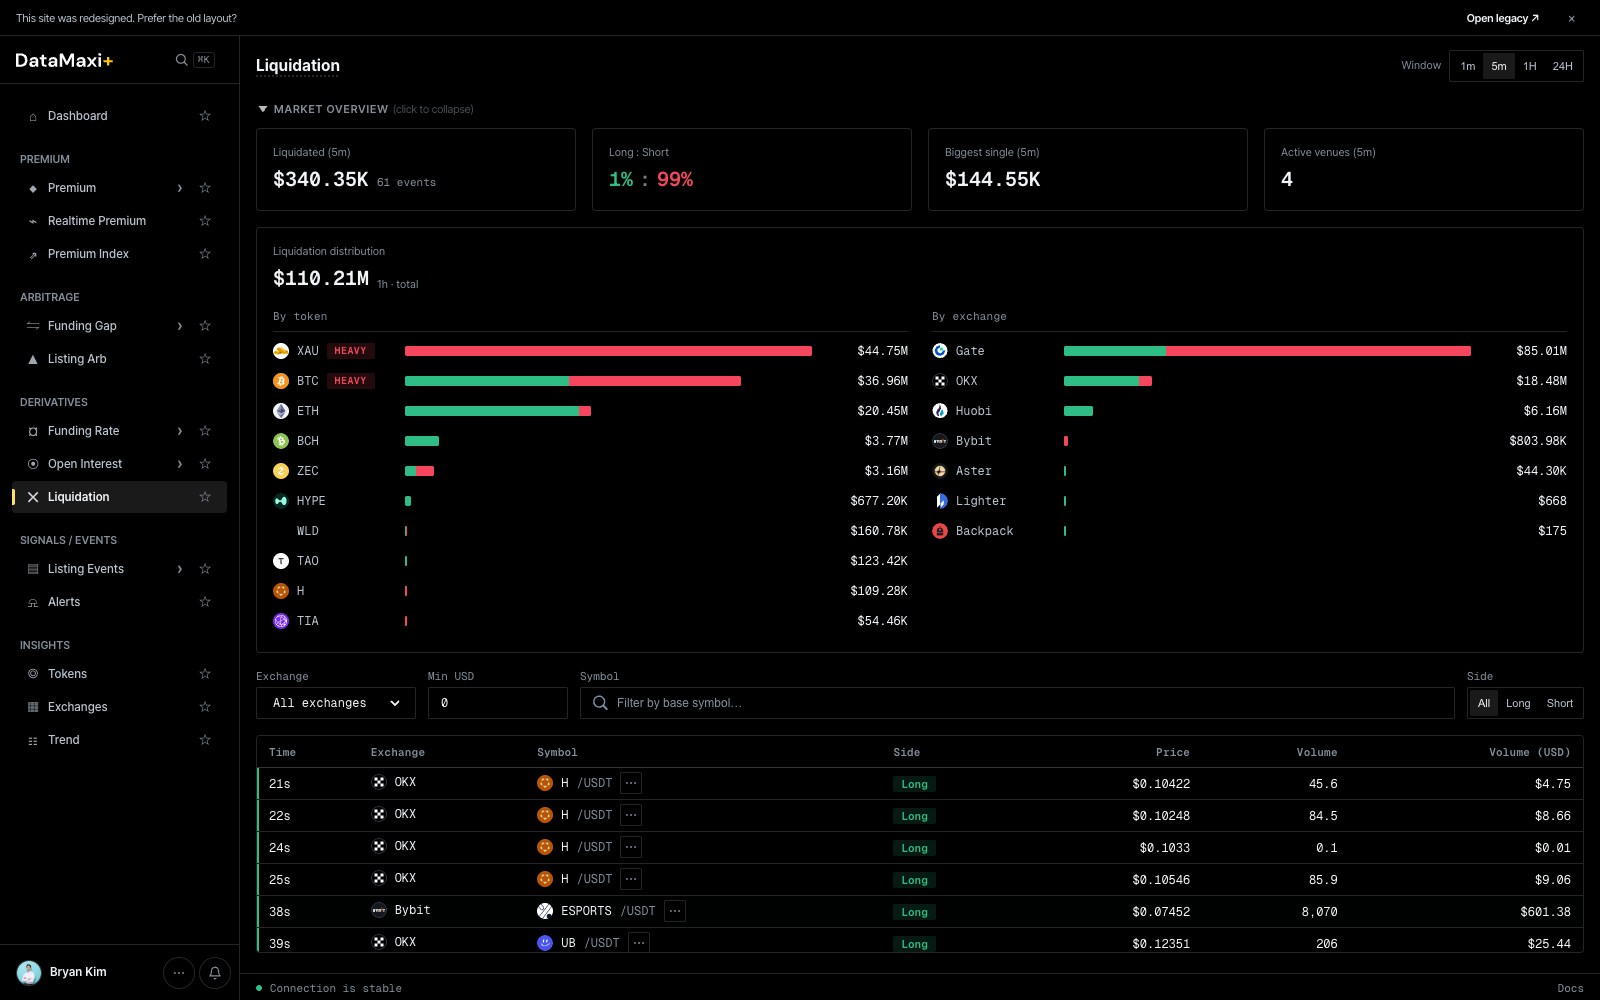
Window selector
Top-right pill: 1m · 5m · 1H · 24H. Sets the rolling window for the overview cards.
Market overview (top, collapsible)
Four headline cards over the chosen window:
- Liquidated — total liquidation notional + event count (e.g.
$1.58B · 156 events). - Long : Short — % split of long-side vs short-side liquidations (
80% : 20%reads as "longs got smoked"). - Biggest single — largest single liquidation in the window.
- Active venues — number of venues that produced at least one liquidation event.
Below the cards, a Liquidation distribution chart breaks the same total down two ways side-by-side:
- By token — horizontal bar per asset, color-coded long vs short, with the dollar size on the right.
- By exchange — same shape, but per venue.
A HEAVY tag marks tokens with abnormally large liquidation flow in the window — the assets to watch.
Filter bar
- All exchanges ▼ — venue filter.
- Min USD — drop micro-events below this size.
- Symbol — search to a base asset.
- Side pills —
All · Long · Short.
Live feed table
| Column | Description |
|---|---|
| Time | seconds ago (6s, 11s, …) |
| Exchange | venue (Bybit, OKX, …) |
| Symbol | base asset + quote (USDT) |
| Side | Long or Short chip (red / green) |
| Price | liquidation price |
| Volume | liquidated size in base asset |
| Volume (USD) | USD-converted size |
New rows append at the top in real time.
Detail view
Clicking any liquidation event navigates to /liquidation/<token> — a per-token liquidation profile.

Header
- Token symbol + glyph +
TOKEN-LIGHTchip. - Window pills (
1m · 5m · 1H · 24H) — applied to the cards below. - Four headline cards for the chosen window:
- Total liquidated (USD).
- Long : Short ratio.
- Biggest single liquidation.
- Active venues count.
Liquidation Map (left chart)
A combined histogram + cumulative-curve chart. Bars show liquidation volume per price-bucket (red = long liquidations, green = short); the overlaid curves show the accumulated long-liquidation USD and short-liquidation USD totals as price moves up. Use it to spot the dangerous-side levels — where a price move will trigger the next cascade.
Liquidation History (right chart)
Time-series of long vs short liquidation events for the token. Pair with the Map chart to see when the cascades clustered.
Recent liquidations table
Live feed of the most recent events for this token, with venue / side / price / volume / total. Same shape as the parent page but filtered to this token.
24h liquidation markers
A condensed price chart with liquidation events marked along the price line — a visual confirmation of "did the liquidations happen at the wick or on the way down".
When to use this page
- Live regime read: a sudden shift in Long : Short tells you which side is unwinding.
- Cascade watch: rising "Biggest single" + falling "Active venues" can signal a venue-specific squeeze.
- Risk: see if a token you hold is in the
HEAVYlist — your funding/borrow may move soon.
Listing Events
A normalized feed of listing and delisting announcements from every covered venue — the raw signal that drives Listing Arb.
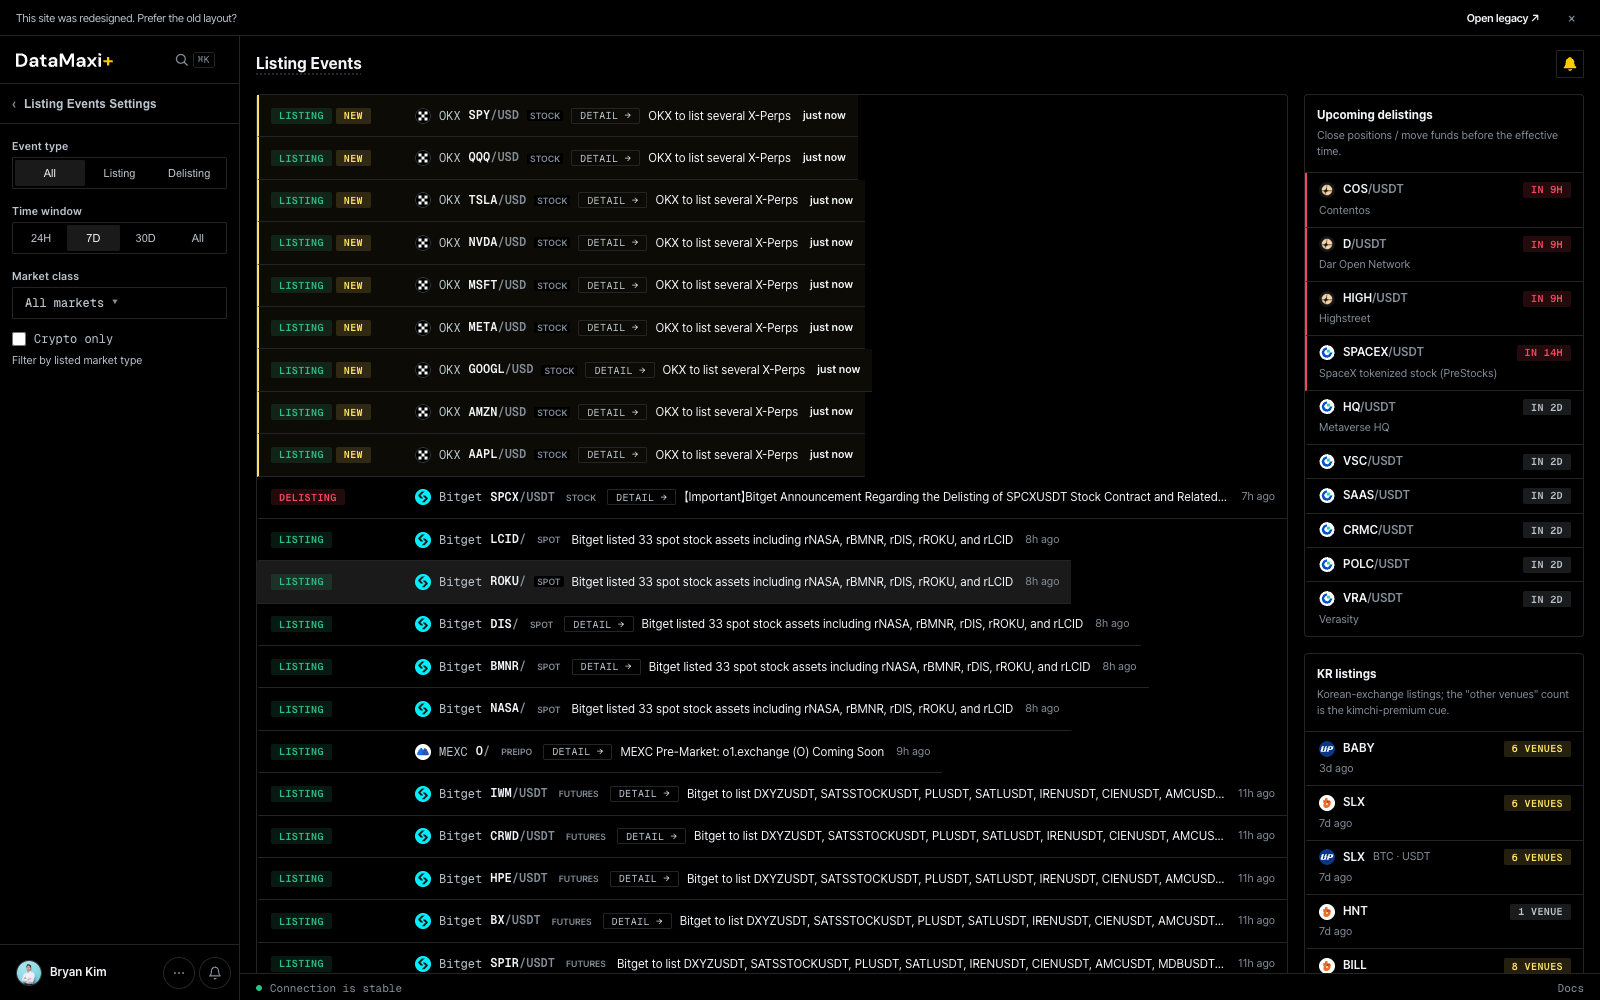
Event filters
Top of the page:
- Event type —
All · Listing · Delisting. - Window —
24H · 7D · 30D · All. - Markets —
All markets ▼filter to a specific venue or set.
Listing Events Settings (left rail)
The collapsible left rail mirrors the in-bar filters for one-shot setup, plus:
- Quote filter (e.g. KRW-only to focus on Upbit/Bithumb listing-arb events).
- Saved view — pin filters you use often.
Event rows
Each row shows:
- Time since the announcement (
12 min ago,1h ago, …). - Venue glyph + ticker pair (e.g.
Upbit · SUI/KRW). - Event type chip (
Listing/Delisting). - Title — the announcement headline as posted by the venue, in the original language. Korean titles are kept intact.
Rows are color-banded by venue and event type so you can scan the feed quickly.
Upcoming delistings (right rail)
A persistent list of upcoming scheduled delistings with the venue, asset, and the cutoff date. Useful for risk-checking positions before the venue freezes trading.
KR listings (right rail, bottom section)
A spotlight on Korean-market listings specifically — the source most relevant to listing arbitrage. Keeps the KRW signal isolated from the global firehose.
When to use this page
- You're running listing arb and need the announcement the moment it lands.
- You're risk-managing — confirm a token you hold isn't on an upcoming delisting list.
- You're studying patterns — filter to
Listingover7Dto see which venues are most active and which assets they prefer.
See Strategies → Listing Arbitrage for how to translate these events into trades.
Alerts
Turn any DataMaxi+ signal into a push, email, or Telegram message. Alerts run server-side at the cadence you pick — no need to keep a tab open.
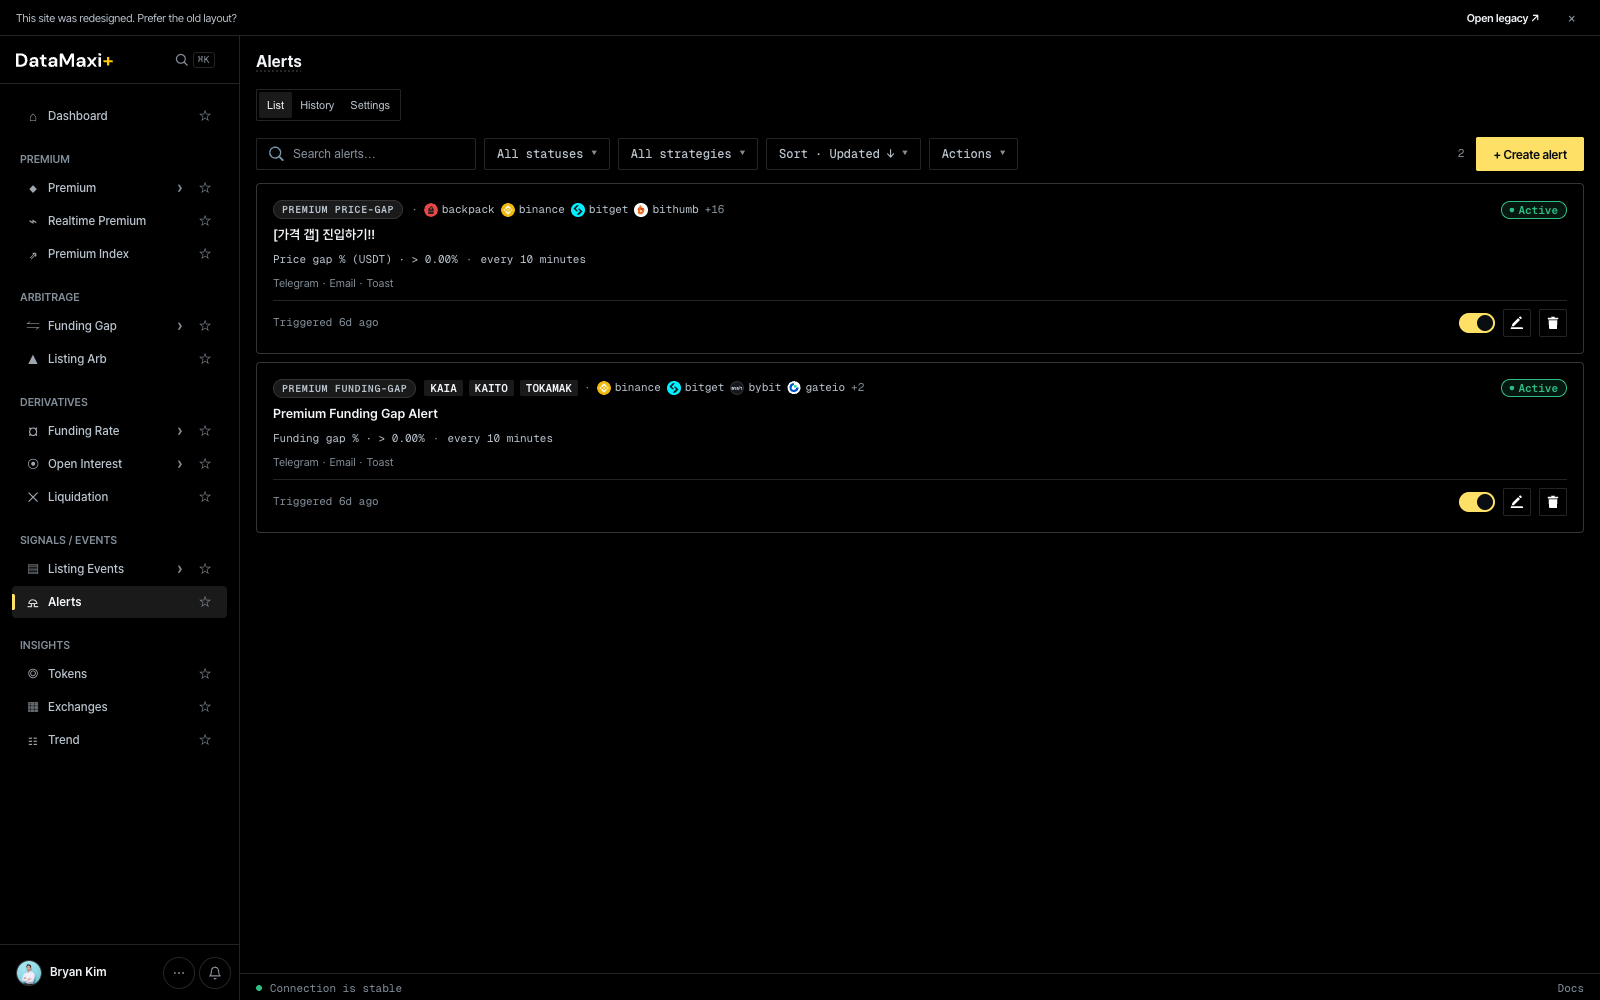
Three tabs
- List — your active and paused alerts.
- History — every time an alert has triggered. Useful for tuning thresholds.
- Settings — global delivery preferences (Telegram chat, email address, default channels).
List view
Top toolbar:
- Search alerts…
- All statuses ▼ —
Active / Paused / Triggered / All. - All strategies ▼ — narrow to a specific strategy family (Premium price-gap, Premium funding-gap, Listing event, etc.).
- Sort · Updated ↓ ▼ — sort order.
- Actions ▼ — bulk actions on selected alerts.
- + Create alert (top-right) — opens the alert-creation modal.
Each alert card shows:
- Strategy chip — e.g.
PREMIUM PRICE-GAP,PREMIUM FUNDING-GAP,LISTING EVENT. - Venue chips — exchanges in scope (
backpack,binance,bitget,bithumb,+16…). - Title — your label (e.g.
[가격 갭] 진입하기!!,Premium Funding Gap Alert). - Rule — the trigger expression in plain language (e.g.
Price gap % (USDT) · > 0.00% · every 10 minutes). - Delivery channels —
Telegram · Email · Toast. - Last triggered timestamp.
- Right-side: Active toggle, Edit (pencil), Delete (trash).
Creating an alert
+ Create alert opens a 5-step wizard: Identity → Targets → Trigger → Delivery → Review. The step indicator at the top reads 1 Identity · 2 · 3 · 4 · 5 — each step unlocks the next once it's filled in.
Step 0 — Quick presets (optional)
Six built-in templates sit at the top of the modal. Selecting one auto-fills Identity + Targets so you only have to tune Trigger and Delivery.
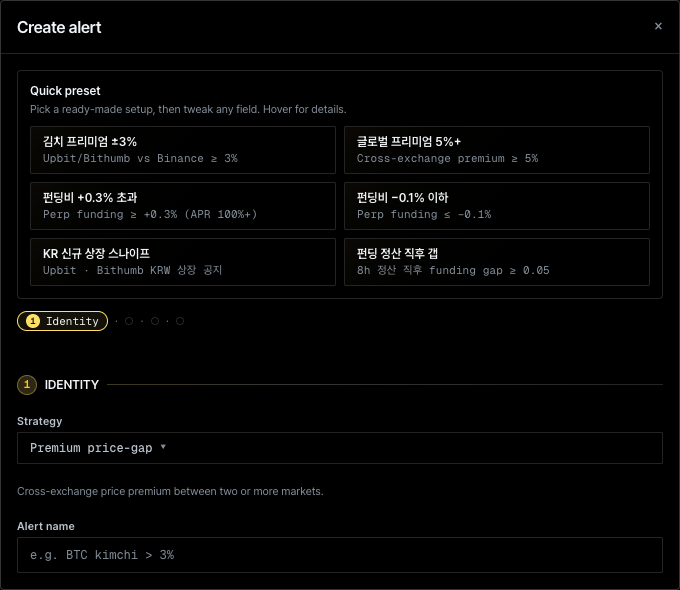
| Preset | Pre-fill |
|---|---|
| 김치 프리미엄 ±3% | Strategy = Premium price-gap, Markets = Upbit/Bithumb vs Binance, threshold ≥ 3% |
| 글로벌 프리미엄 5%+ | Strategy = Premium price-gap, all markets, threshold ≥ 5% |
| 펀딩비 +0.3% 초과 | Strategy = Funding rate, threshold ≥ +0.3% (APR ≈ 100%+) |
| 펀딩비 −0.1% 이하 | Strategy = Funding rate, threshold ≤ −0.1% |
| KR 신규 상장 스나이프 | Strategy = Listing arbitrage, scope = Upbit + Bithumb KRW |
| 펀딩 정산 직후 갭 | Strategy = Premium funding-gap, 8h settlement, gap ≥ 0.05 |
Every preset is editable — change any field and the alert is yours.
Step 1 — Identity
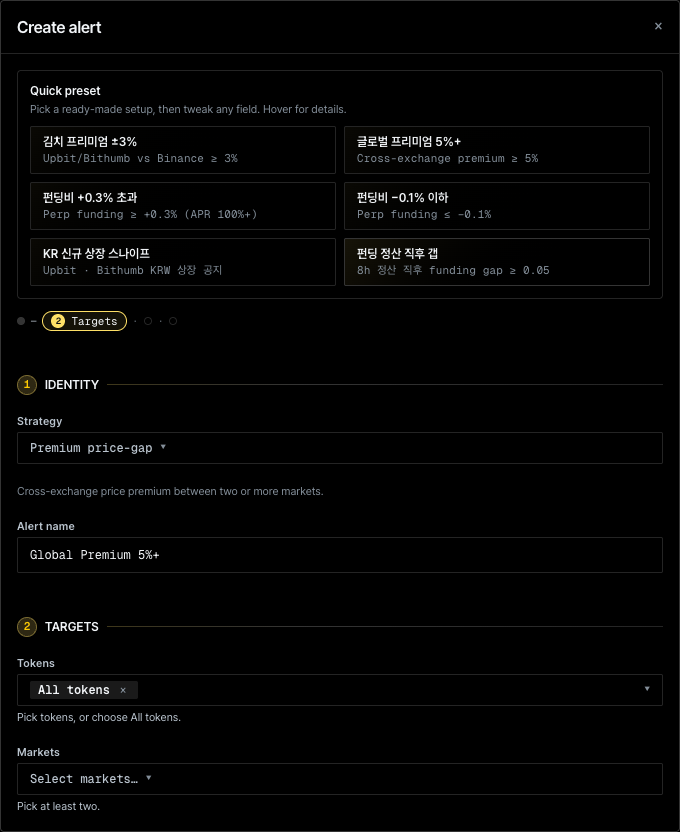
| Field | Description |
|---|---|
| Strategy ▼ | Picks the rule engine. Options: Premium price-gap, Premium funding-gap, Funding rate, Favorite portfolio, Top funding rate, Listing arbitrage. The hint line below the dropdown describes the strategy. |
| Alert name | Free-text label. Used in the list, in delivery messages, and in History. |
Step 2 — Targets
| Field | Description |
|---|---|
| Tokens ▼ | Multi-select with chips. Default is All tokens — type to narrow, or pick explicit symbols. |
| Markets ▼ | Multi-select of venues / symbol legs. At least two markets are required — the strategy needs both sides of the comparison. |
Step 3 unlocks once at least two markets are selected.
Step 3 — Trigger
The Trigger step encodes the rule expression. The exact controls depend on the chosen Strategy, but they always resolve to a sentence in the form:
<metric> · <comparator> · <threshold> · evaluated every <interval>
For example, Price gap % (USDT) · > 0.00% · every 10 minutes — the format you see on every active alert card in the list.
Typical controls:
- Metric (auto-set by Strategy):
Price gap %,Funding rate,APR edge,Premium index, … - Comparator:
>,≥,<,≤,=,between(with a min/max pair). - Threshold: numeric input. Units depend on the metric (% for price/funding, bp if the basis-points toggle is set, USD for size).
- Evaluation interval: how often the rule is re-checked. Common values:
1 / 5 / 10 / 15 / 30 / 60 minutes. Tighter intervals catch fast moves; looser intervals reduce noise. - Cooldown (optional): minimum time between consecutive triggers for the same alert.
Step 4 — Delivery
Pick where the alert goes. Each active card shows its enabled channels as a chip strip (Telegram · Email · Toast).
| Channel | Setup |
|---|---|
| Telegram | Connect the DataMaxi+ Telegram bot once (Settings tab). Each alert pushes a message to your chat. |
| Sent to the account email on file. | |
| Toast | Renders in the app's in-page notification stream — useful when you have DataMaxi+ open in a tab. |
Multiple channels can be enabled per alert; deliveries fan out in parallel.
Step 5 — Review & Create
The final step shows a read-only summary of everything above so you can sanity-check before saving. Submit creates the alert and returns you to the list with it set to Active by default. Toggle, edit, or delete from the list at any time.
Steps 3–5 screenshots are not included — they only render once Targets passes validation with two valid markets, which automated capture couldn't reliably do. The field descriptions above are derived from the rule format visible on the active alert cards plus the platform's standard delivery channels.
Alerts evaluate server-side; you don't need DataMaxi+ open in a browser.
When to use this page
- Set "tell me when X premium goes above N%" and walk away.
- Get a Telegram ping the moment a KRW-market listing announcement matches your filter.
- Tune thresholds by reading History — which alerts fire usefully vs. spam.
Tokens
A universal token catalog — every asset DataMaxi+ tracks, sortable on the columns that matter.
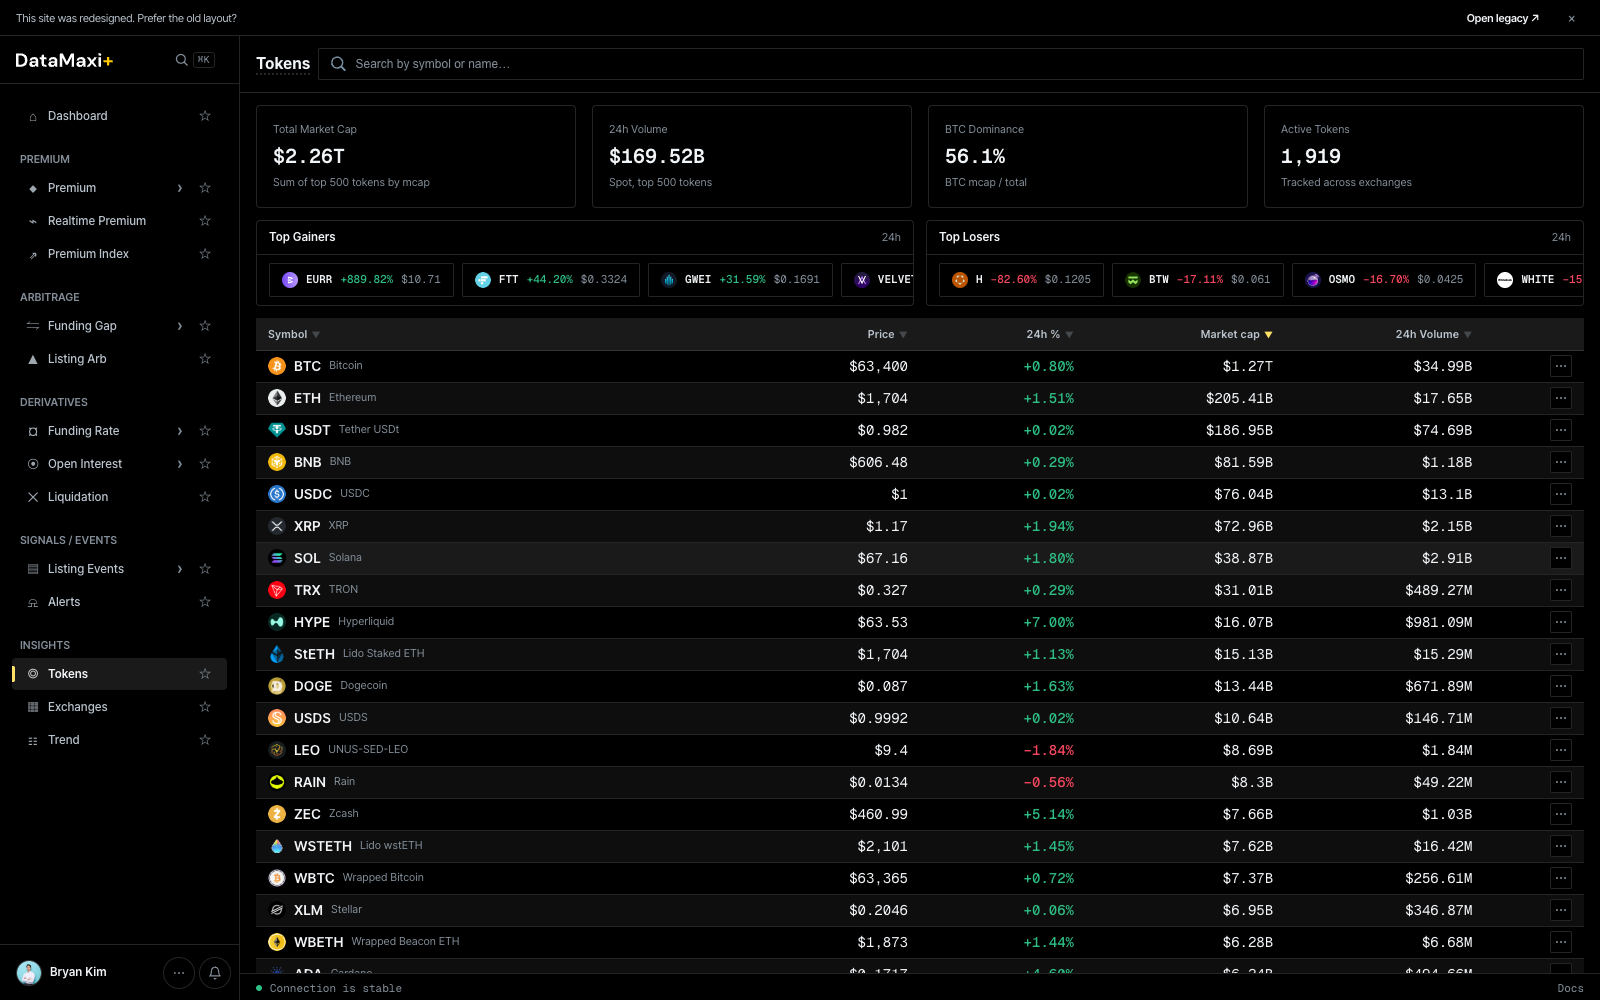
Header KPIs
Four cards across the top summarize the current state of the catalog:
- Total Market Cap — sum of tracked tokens.
- 24h Volume.
- BTC Dominance (%).
- Active venues count.
Top Gainers / Top Losers
Two side-by-side strips just below the KPIs:
- Top Gainers (24h) — biggest positive movers.
- Top Losers (24h) — biggest decliners.
Each row shows the token, price, and 24h %.
Main table
| Column | Description |
|---|---|
| Symbol ▼ | base asset ticker + name |
| Price ▼ | last price in USD |
| 24h % ▼ | 24h price change |
| Market cap ▼ | circulating supply × price |
| 24h Volume ▼ | aggregate 24h trade volume |
Every column header is sortable. The footer Load more (30/1919) paginates through the full catalog — there are ~1,919 tracked tokens at time of writing.
Detail view
Clicking any row navigates to /token/<token-id> — a dedicated token detail page.
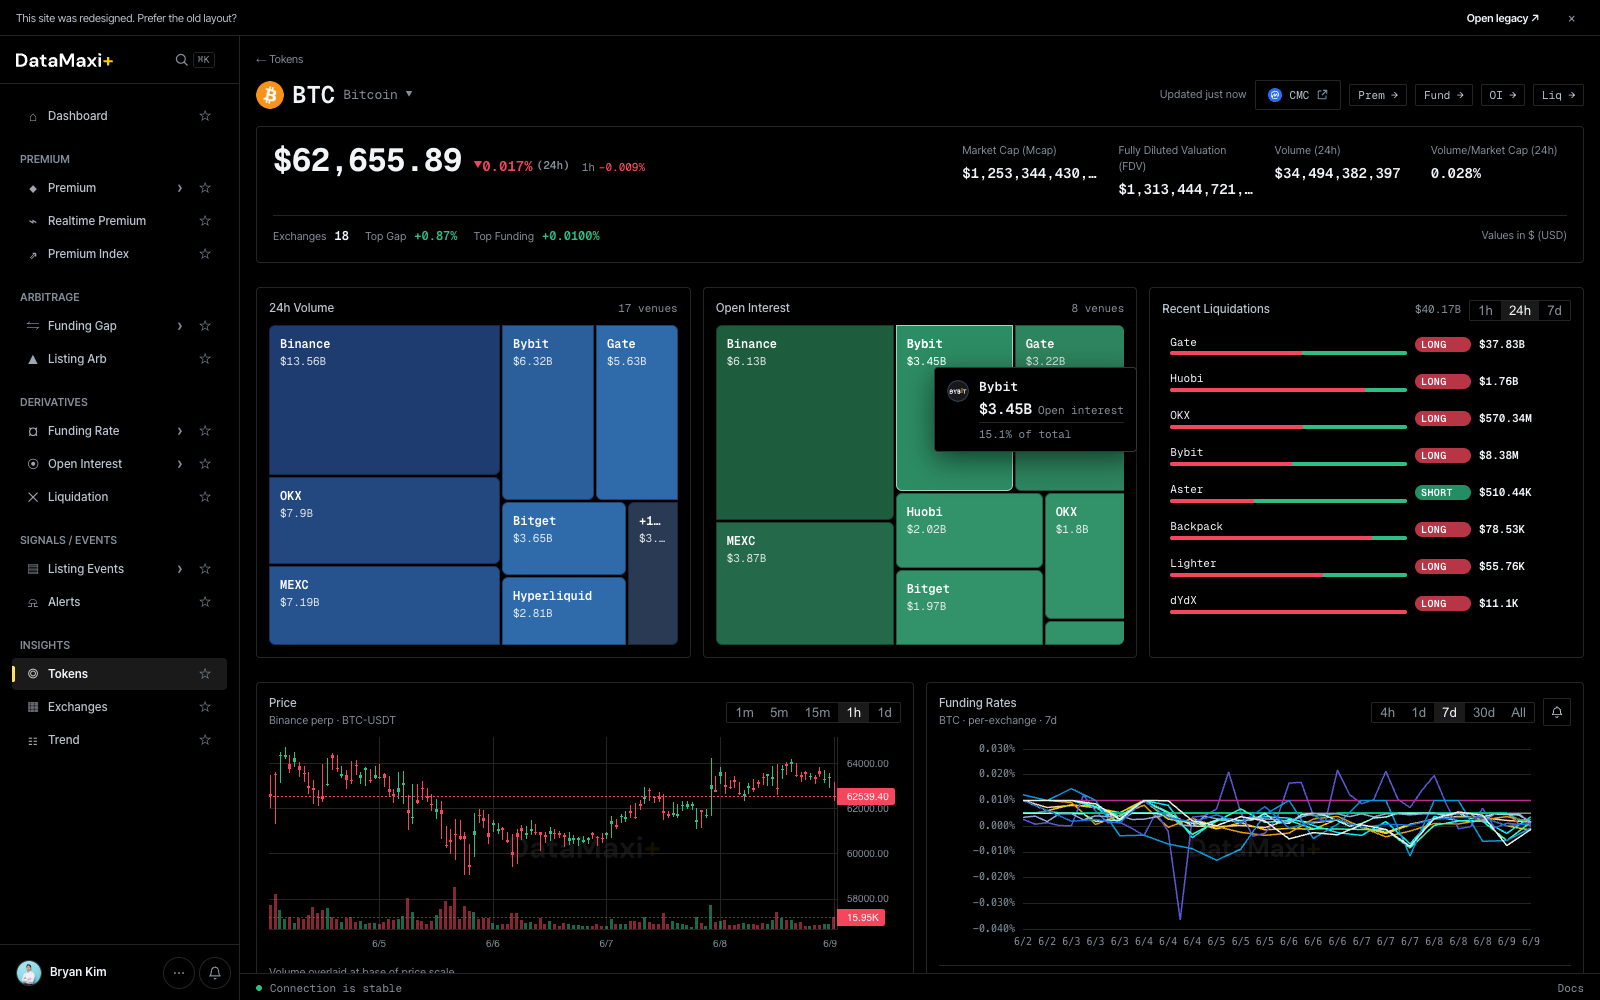
Header
- Symbol + name + current price + 24h %.
- Live trading badges: which venues currently quote the token, with the highest-volume venue pinned first.
Treemaps
Side-by-side per-venue breakdowns for the selected token:
- 24h Volume — venue share of spot volume for this token.
- Open Interest — venue share of perp OI for this token.
- Liquidations (right strip) — per-venue long/short liquidation events.
OI & Volume / Liquidation charts (mid-page)
Below the treemaps, two large chart blocks span the page side-by-side:
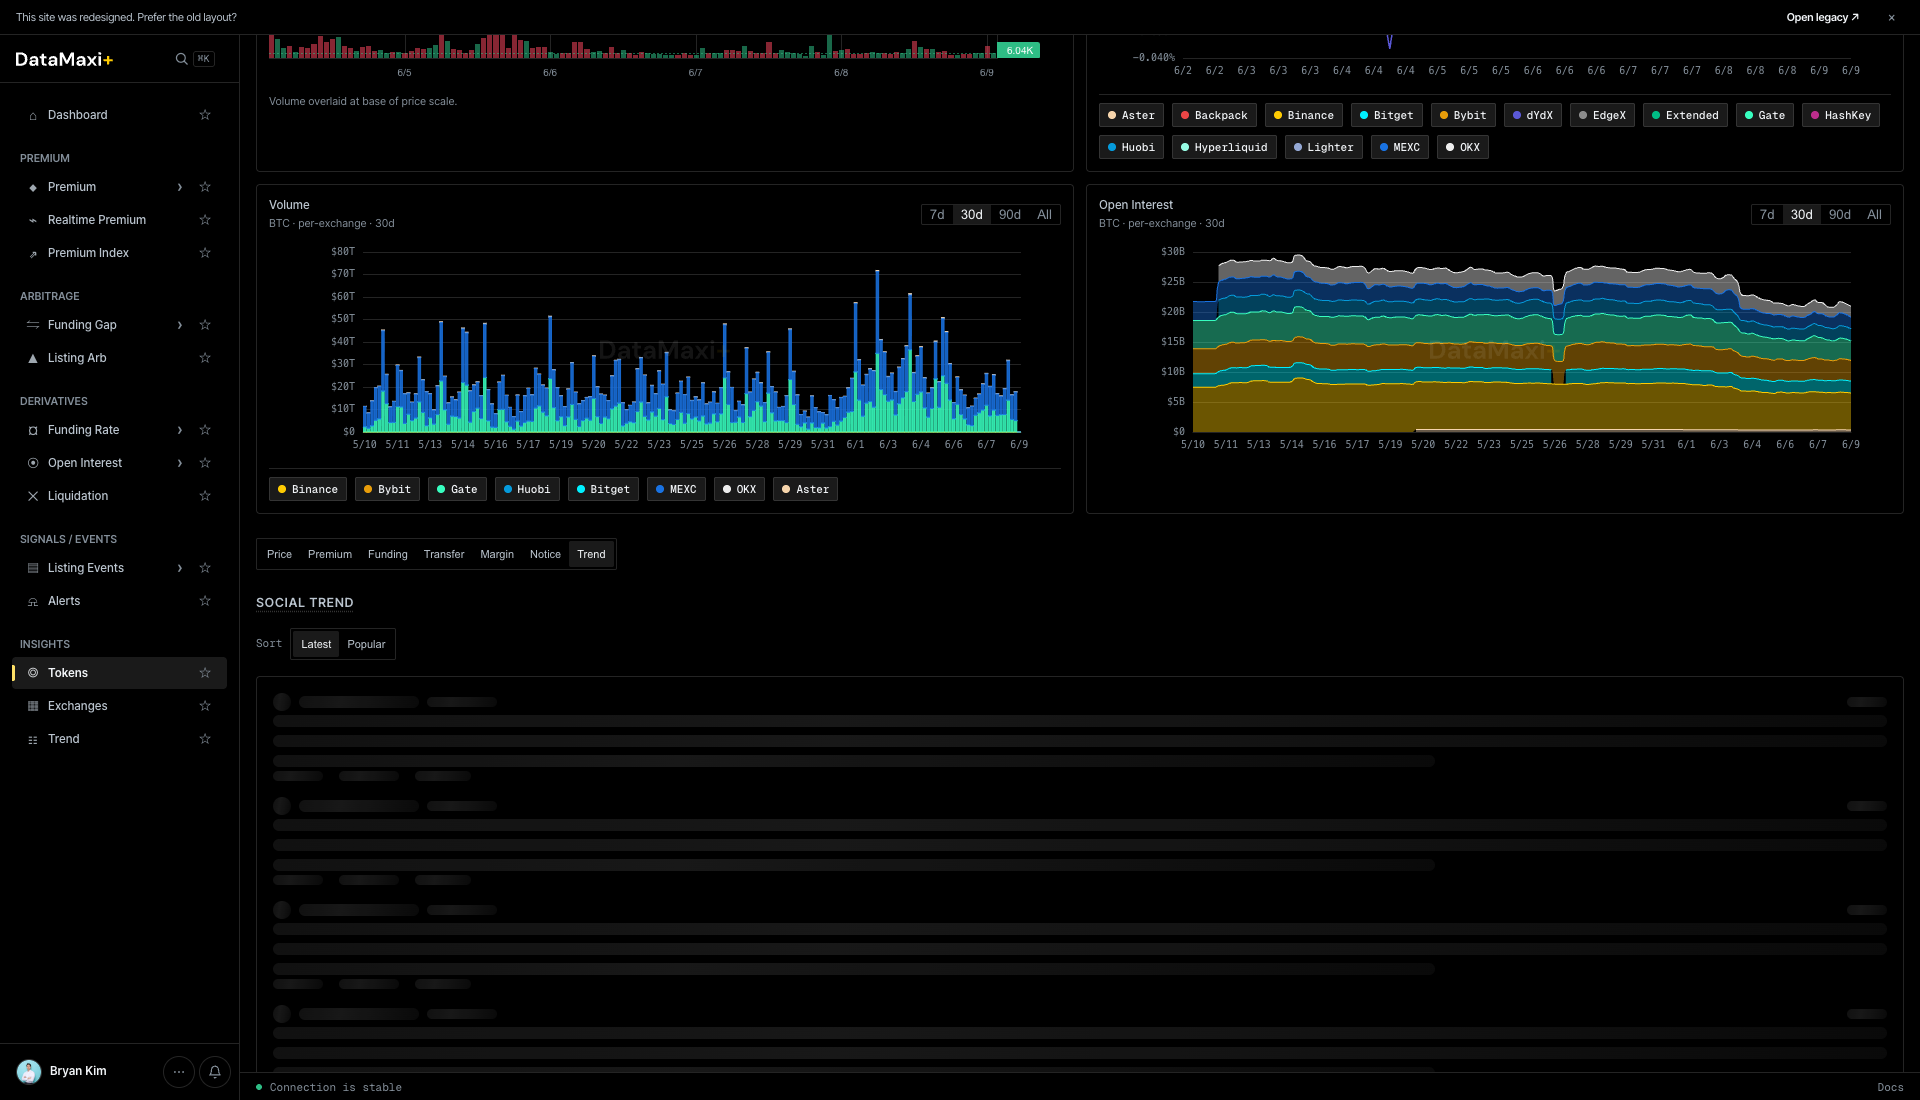
- Volume (left) — a stacked-bar per-venue 24h volume chart over the chosen window (
1m · 5m · 15m · 1h · 1d). Color bands map to the venue chips above the chart (Binance, Bybit, OKX, MEXC, …). Drag the bottom slider to zoom into a specific window. - Open Interest (right) — stacked-area per-venue perp OI chart over the same window. Same color encoding as the Volume chart, with
1d · 7d · 30d · Allrange selectors. Lets you spot which venue's OI is growing or shrinking relative to the others.
Sub-tabs (bottom of page)
Below the charts sits a row of sub-tabs that swap out the bottom panel: Price · Premium · Funding · Transfer · Margin · Notice · Trend.
Each tab is a focused, venue-comparing surface for one dimension of the token.
Price
Default sub-tab. Cross-venue price ladder + per-venue last-price table for the token.
Premium
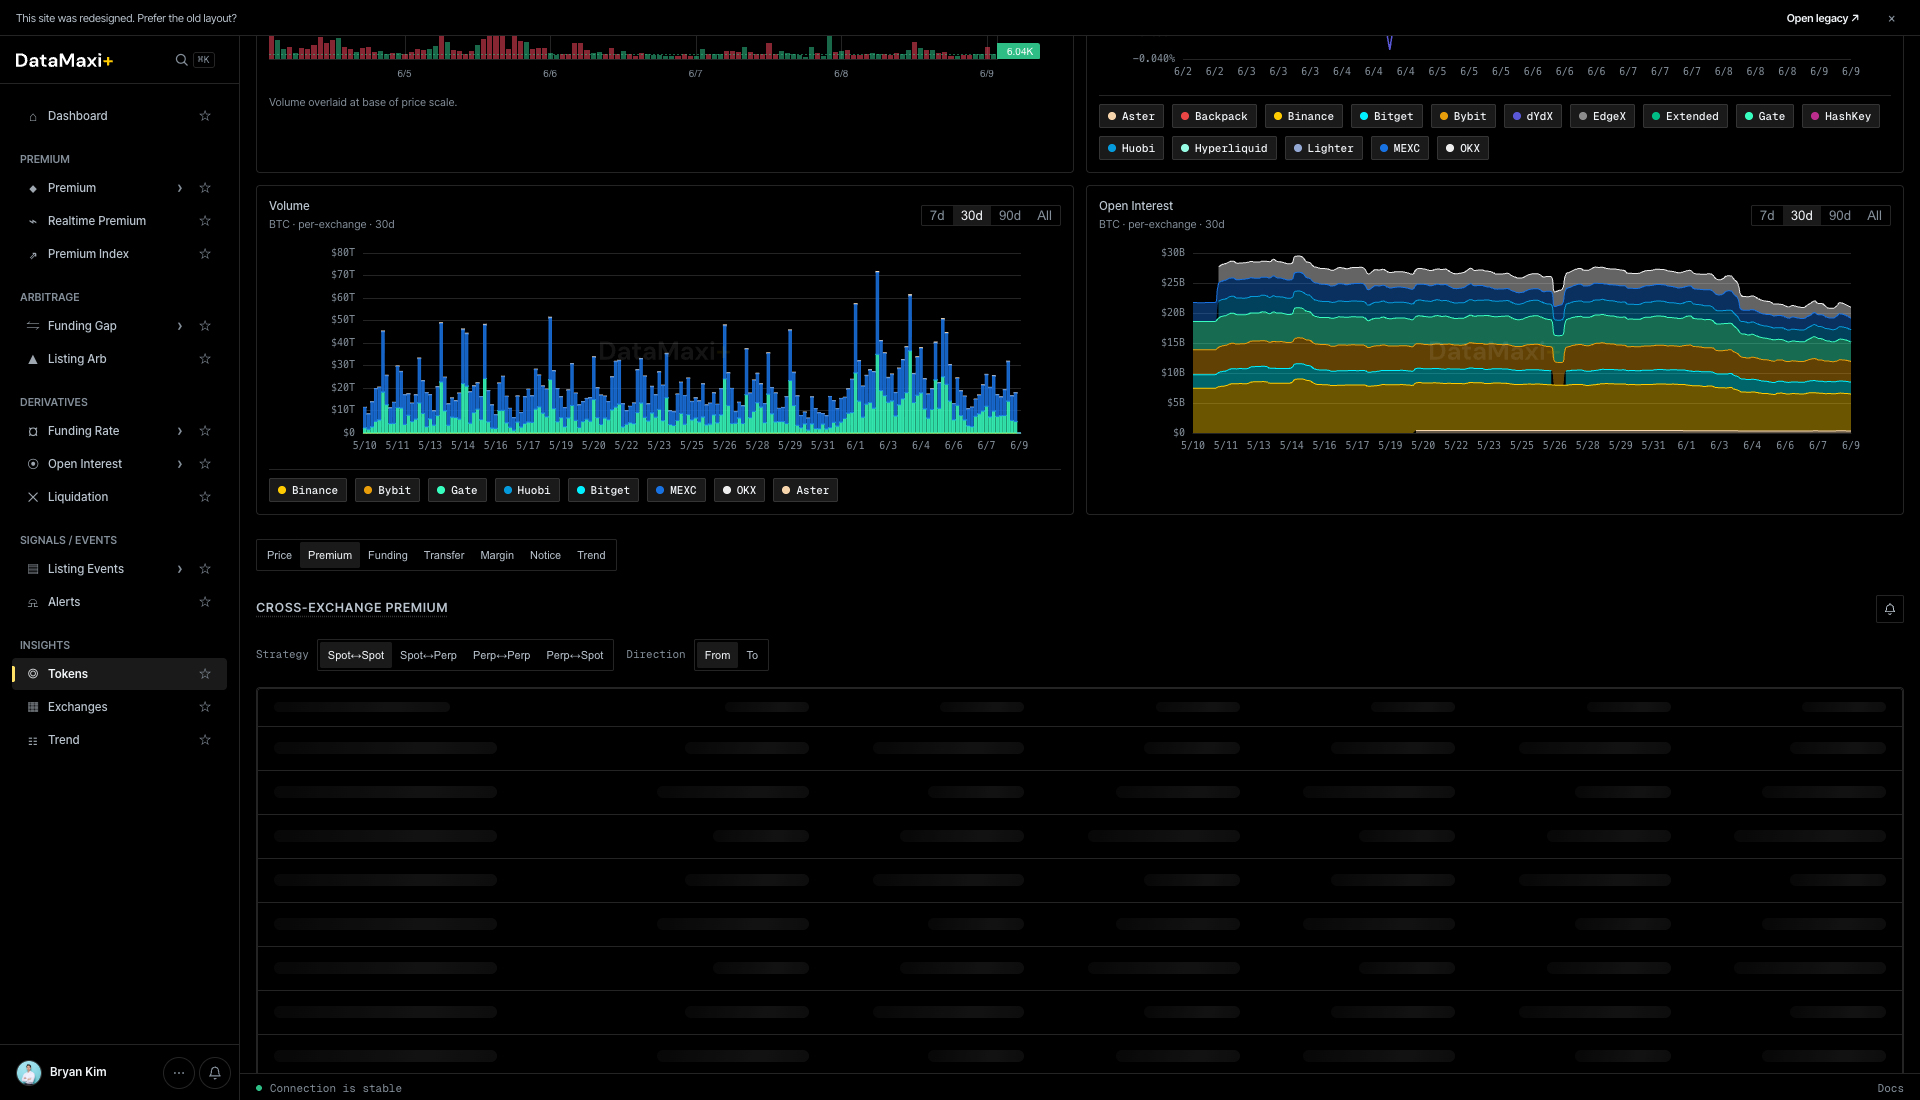
Cross-exchange premium for this token, with leg-type pills along the top (Spot–Spot · Spot–Perp · Perp–Spot · Perp–Perp · Direction…). Below, a per-pair ladder showing live premium per venue pair — the same data as the Premium screener filtered to this asset.
Funding
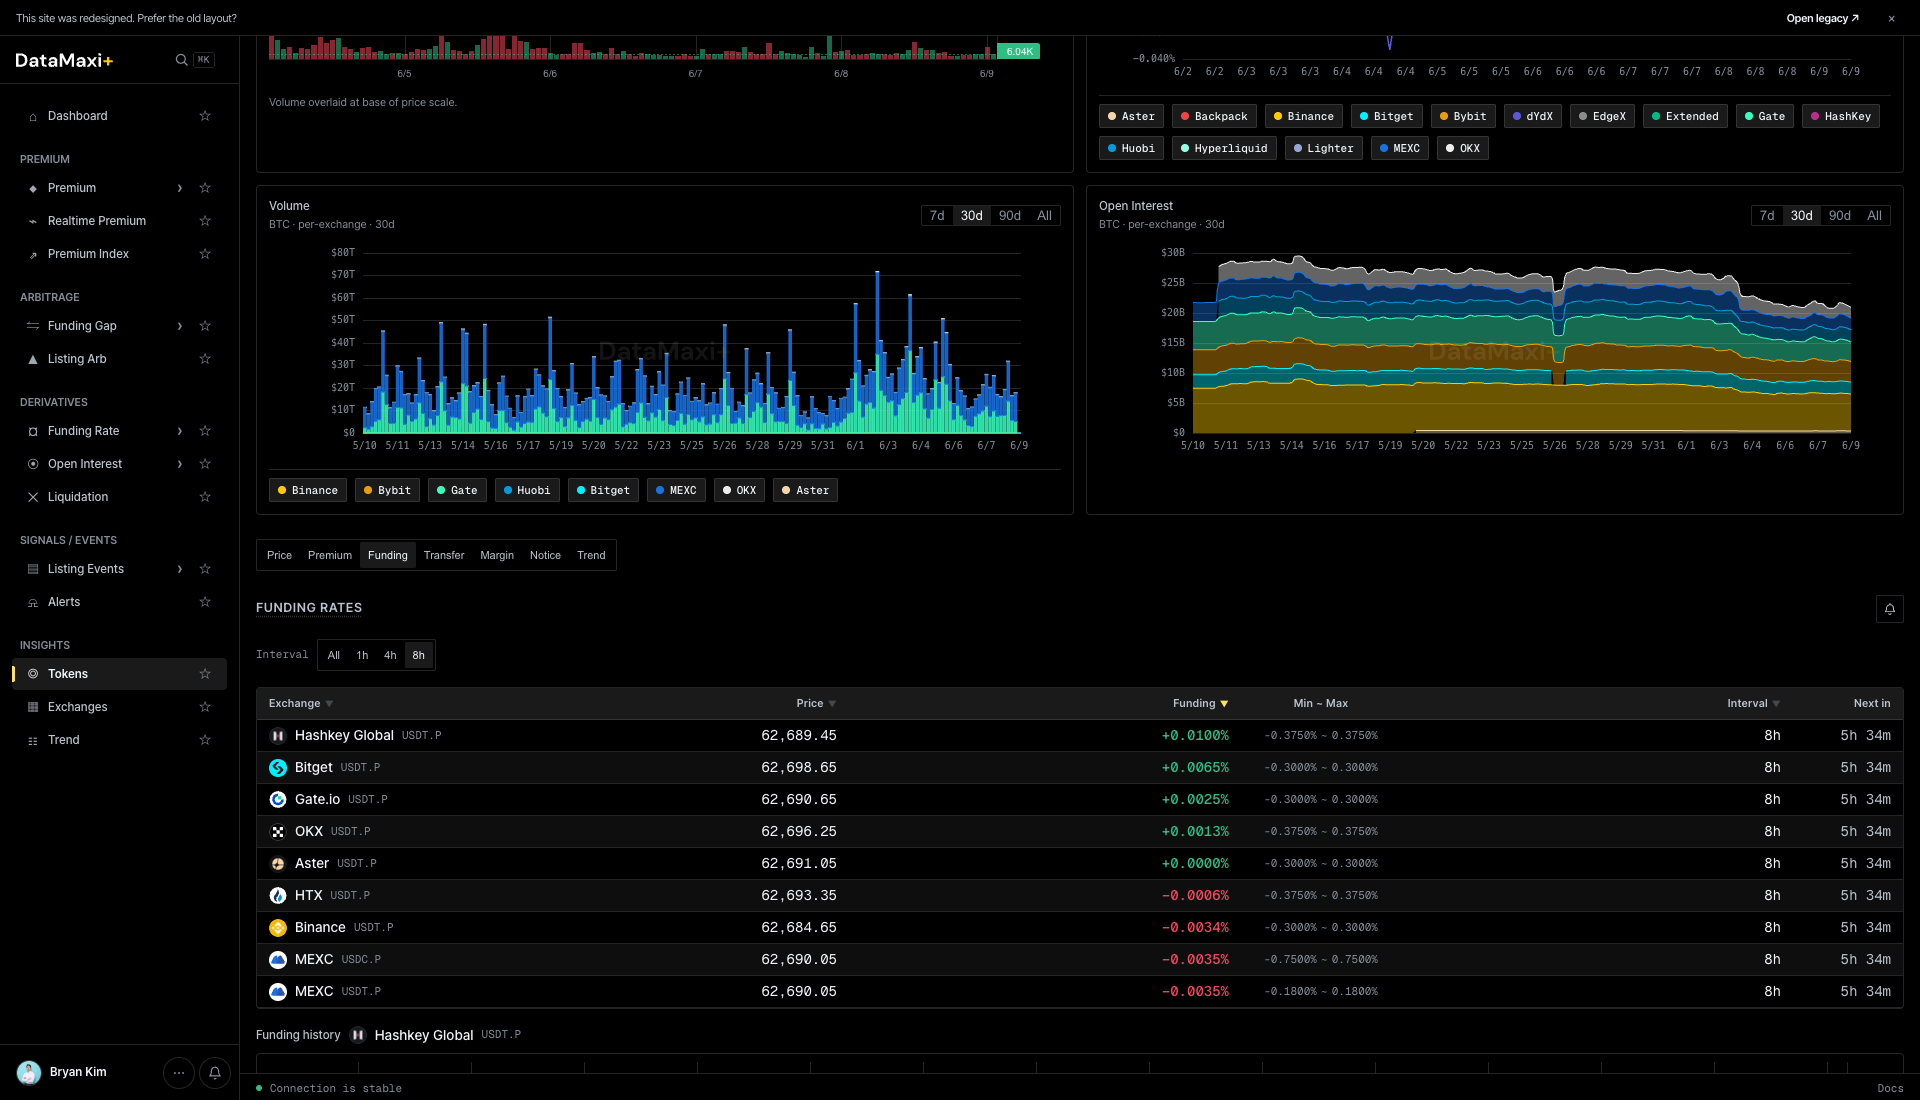
A per-venue funding-rate table for the token — current funding, min–max, interval, next-settlement. Same shape as a single row inside Funding Rate, expanded.
Transfer
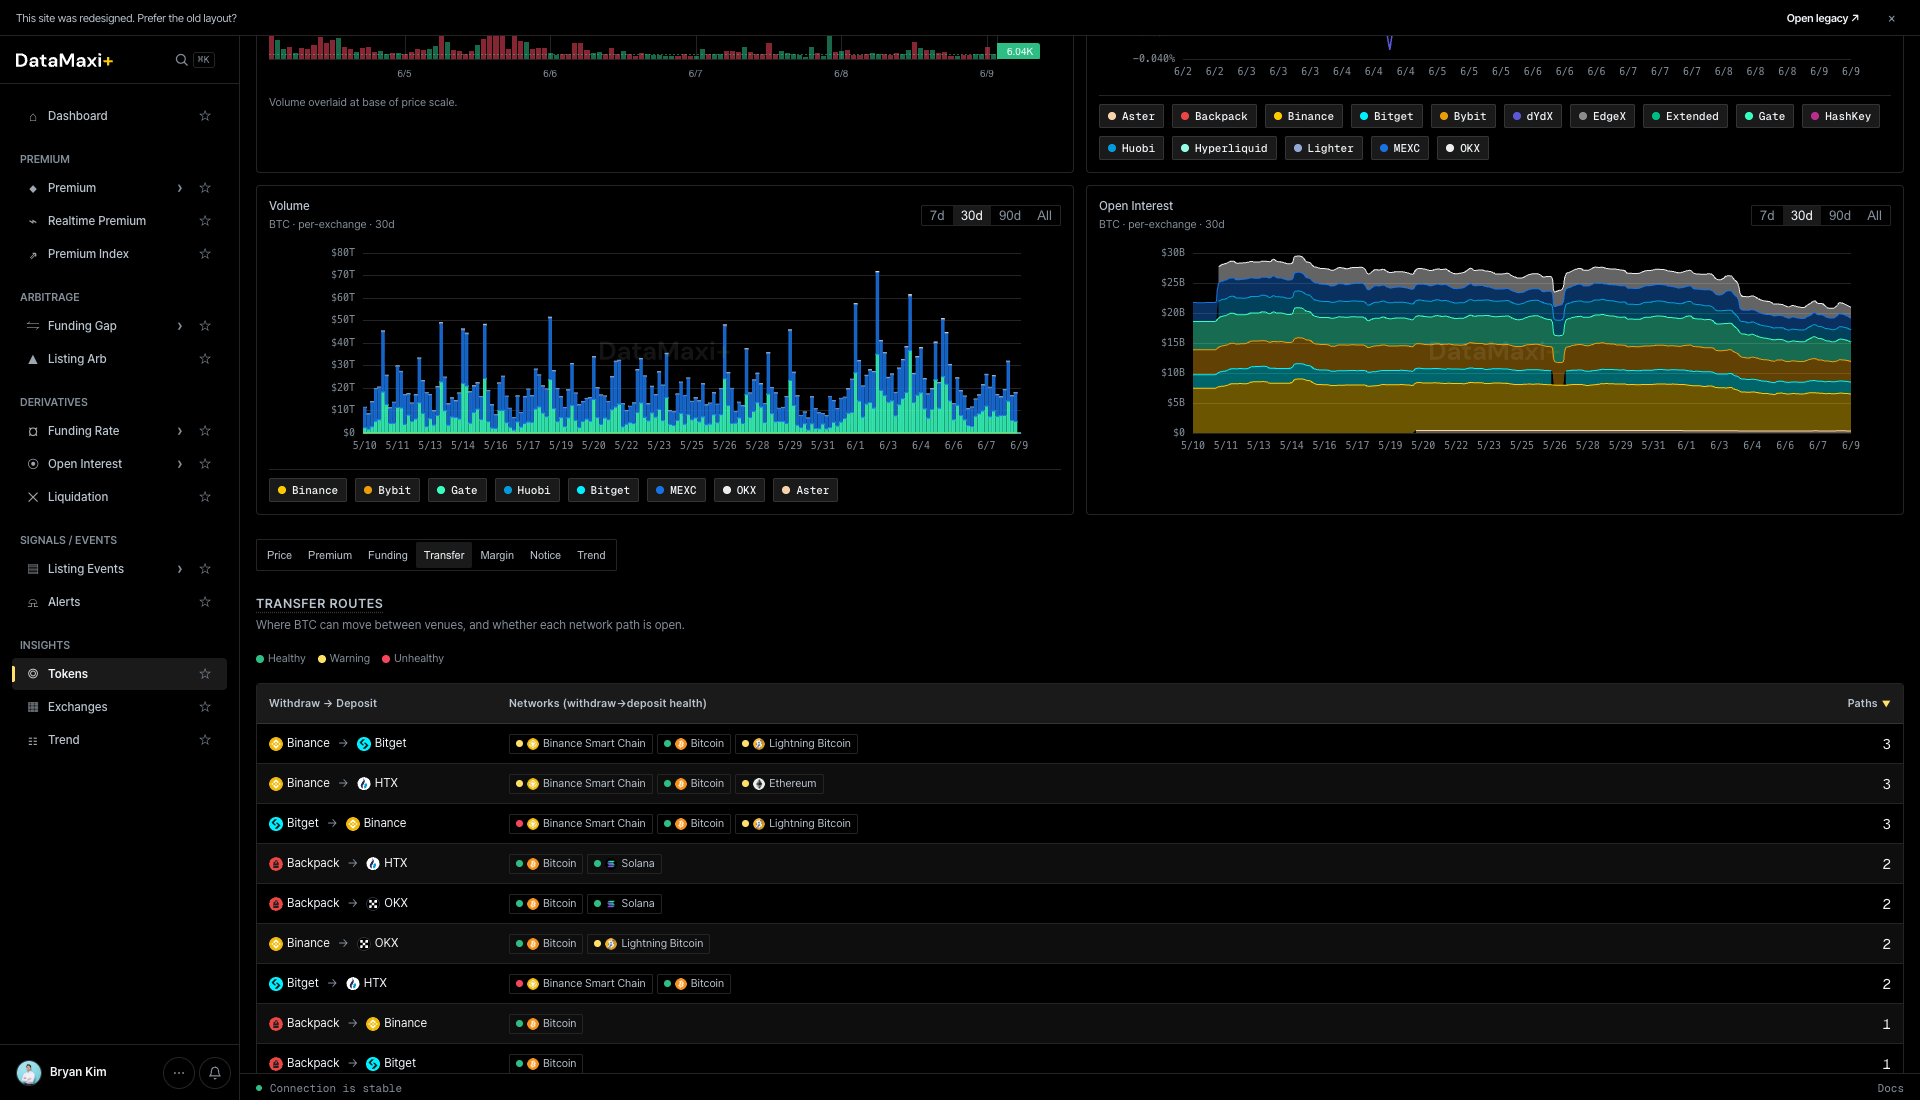
Transfer routes — a matrix of withdraw → deposit venue pairs with the supported networks. Use it to plan the cheapest / fastest route when you need to move the token between venues to capture a spread. The Faster ↓ column ranks routes by typical settlement speed.
Margin
Margin-borrow rates per venue for the token — relevant if your strategy needs to short the spot leg.
Notice
Per-venue exchange notices and announcements that mention this token (listings, delistings, caution-tag changes, fee changes, network upgrades).
Trend
Social trend for the token — Telegram channel mention volume + Naver search interest pulled from the Trend data, with Latest / Popular sort. Useful when you suspect a narrative is driving the price move.
The same detail template is used by the Trend page: clicking a Trend row jumps to /token/<token-id> for the underlying asset.
When to use this page
- You're sizing the universe — how many tokens fit a market-cap or volume threshold for a strategy.
- You're checking liquidity on a candidate before trading it.
- You want a quick "rank by 24h move" sanity check on the broad market.
Exchanges
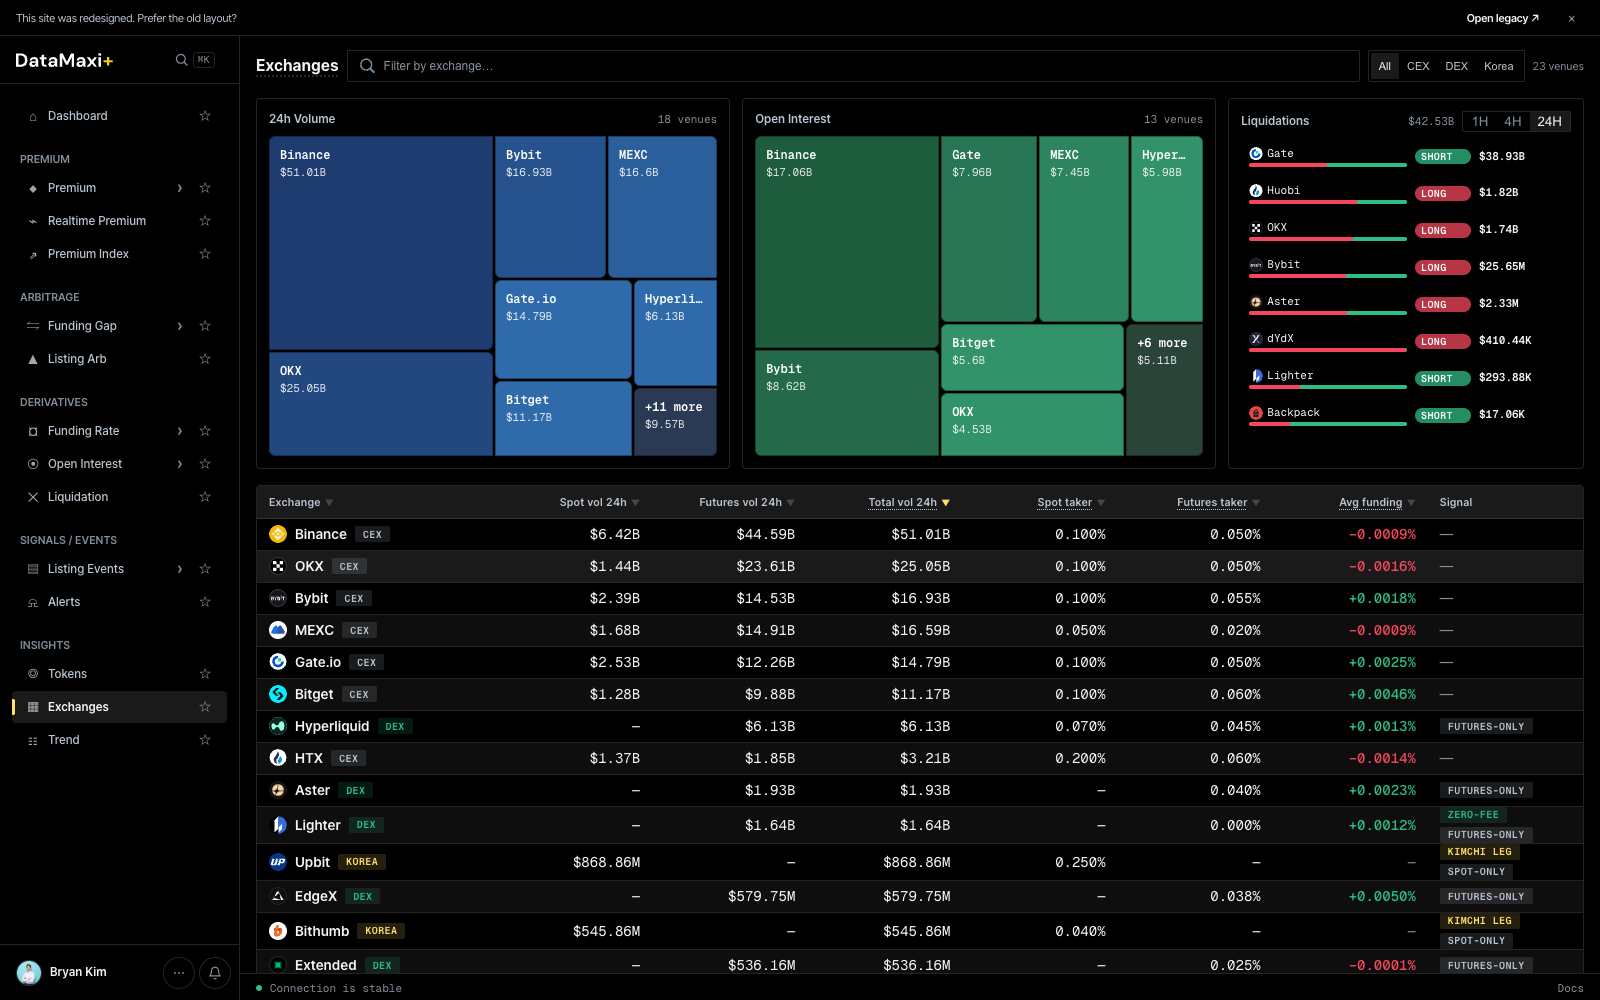
A normalized view of every venue DataMaxi+ covers — volume, fees, average funding, and a signal column for at-a-glance comparison.
Treemaps
Top of the page, three side-by-side treemaps:
- Spot Volume — share of 24h spot volume by venue (Binance, Bybit, MEXC, …).
- Open Interest — share of perp OI by venue.
- Liquidations — share of 24h liquidations by venue.
Cell size encodes share, cell color encodes 24h delta. A glance tells you who's dominating each surface today.
Filter pills
- All · CEX · DEX · Korea — narrow the table.
- Window —
1H · 4H · 24Hselects the time horizon for the volume / funding stats.
Main table
| Column | What it shows |
|---|---|
| Exchange ▼ | venue name + logo |
| Spot vol 24h ▼ | 24h spot trade volume |
| Futures vol 24h ▼ | 24h perp / futures volume |
| Total vol 24h ▼ | sum of the two |
| Spot taker ▼ | reference spot taker fee |
| Futures taker ▼ | reference perp taker fee |
| Avg funding ▼ | average current funding across the venue's perps |
| Signal | venue health / activity signal chip |
Sort by any column. The fee columns reflect the public reference rates — your actual rate depends on your VIP tier on the venue.
Detail view
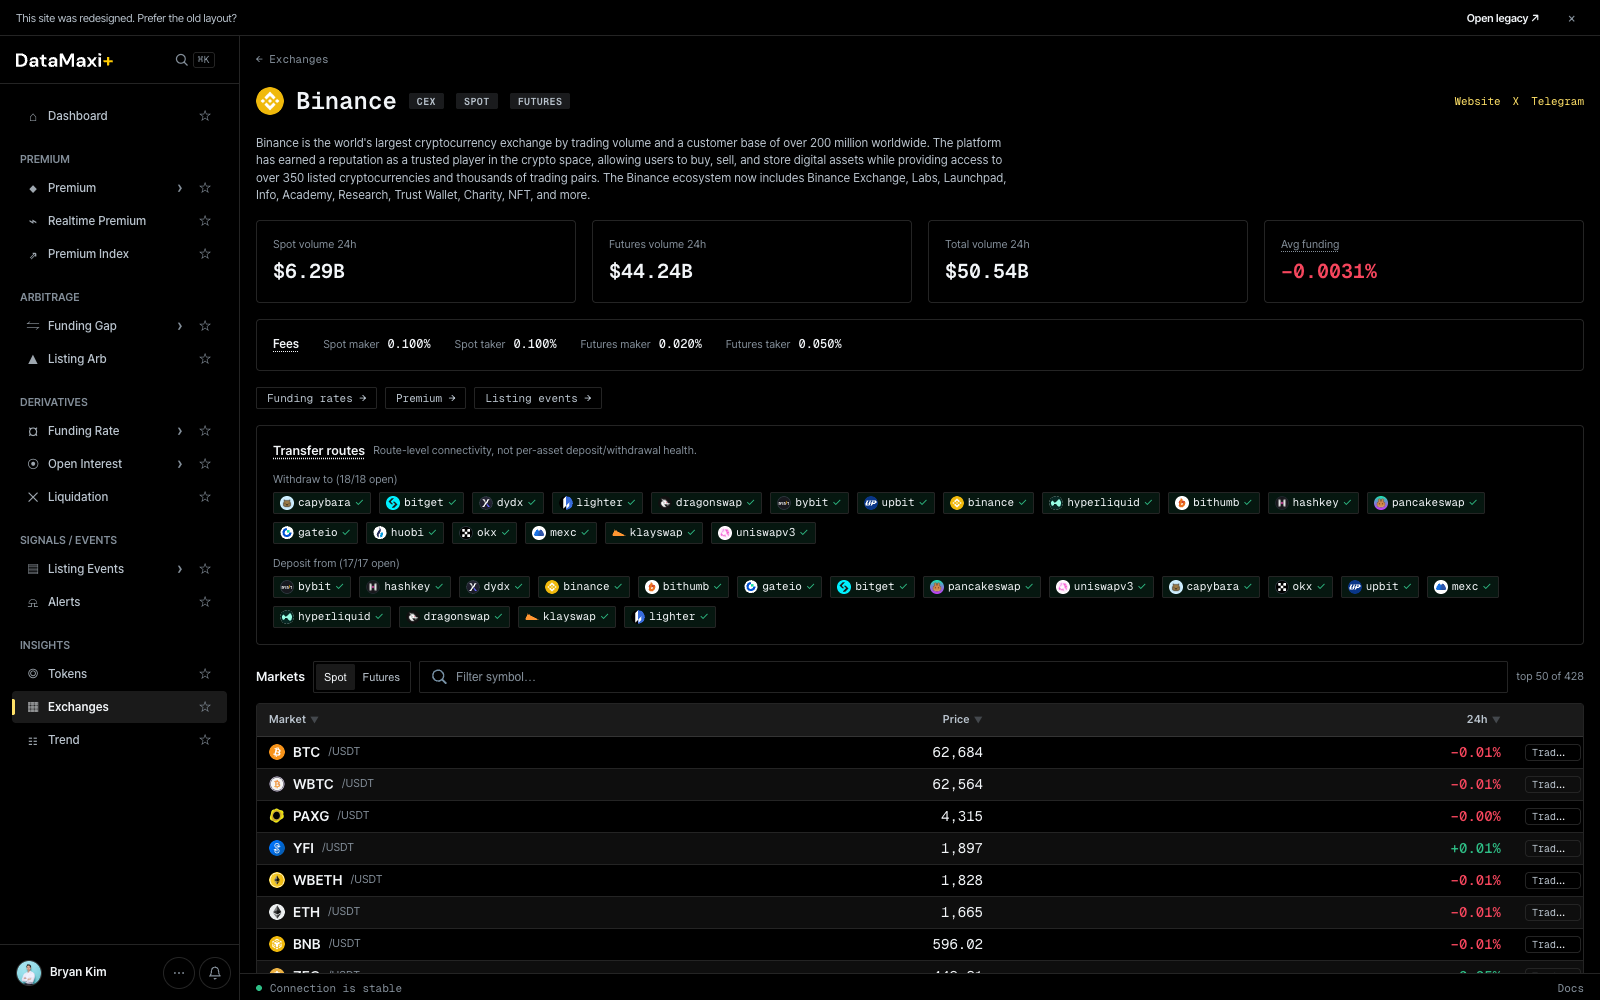
Clicking any exchange row navigates to /exchanges/<venue> — a per-venue profile.
Header
- Venue name + logo + region/jurisdiction.
- One-paragraph venue description (year established, scope, typical use cases).
- Headline stats: Spot volume (24h), Futures volume (24h), Total volume (24h), Funding (24h) with delta.
Section tabs
Funding rates · Premium · Listings events — switches the lower panel between the three datasets surfaced for this venue.
Transfer matrix
Two condensed rows of venue chips representing where assets can be transferred to/from this venue. Each chip is colored by lane direction. Useful when planning cross-venue legs.
Markets table
Symbol-level table for the venue:
| Column | What it shows |
|---|---|
| Symbol | base / quote pair |
| Last | last price |
| 24h % | 24h price change |
Pagination at the footer for the full universe.
When to use this page
- You're picking a venue for a new leg — compare fees and depth side-by-side.
- You're sizing strategy capacity — how much do you need to deploy to be 1% of a venue's 24h volume.
- You're risk-watching — a venue with collapsing volume but rising funding is often a tell.
Trend
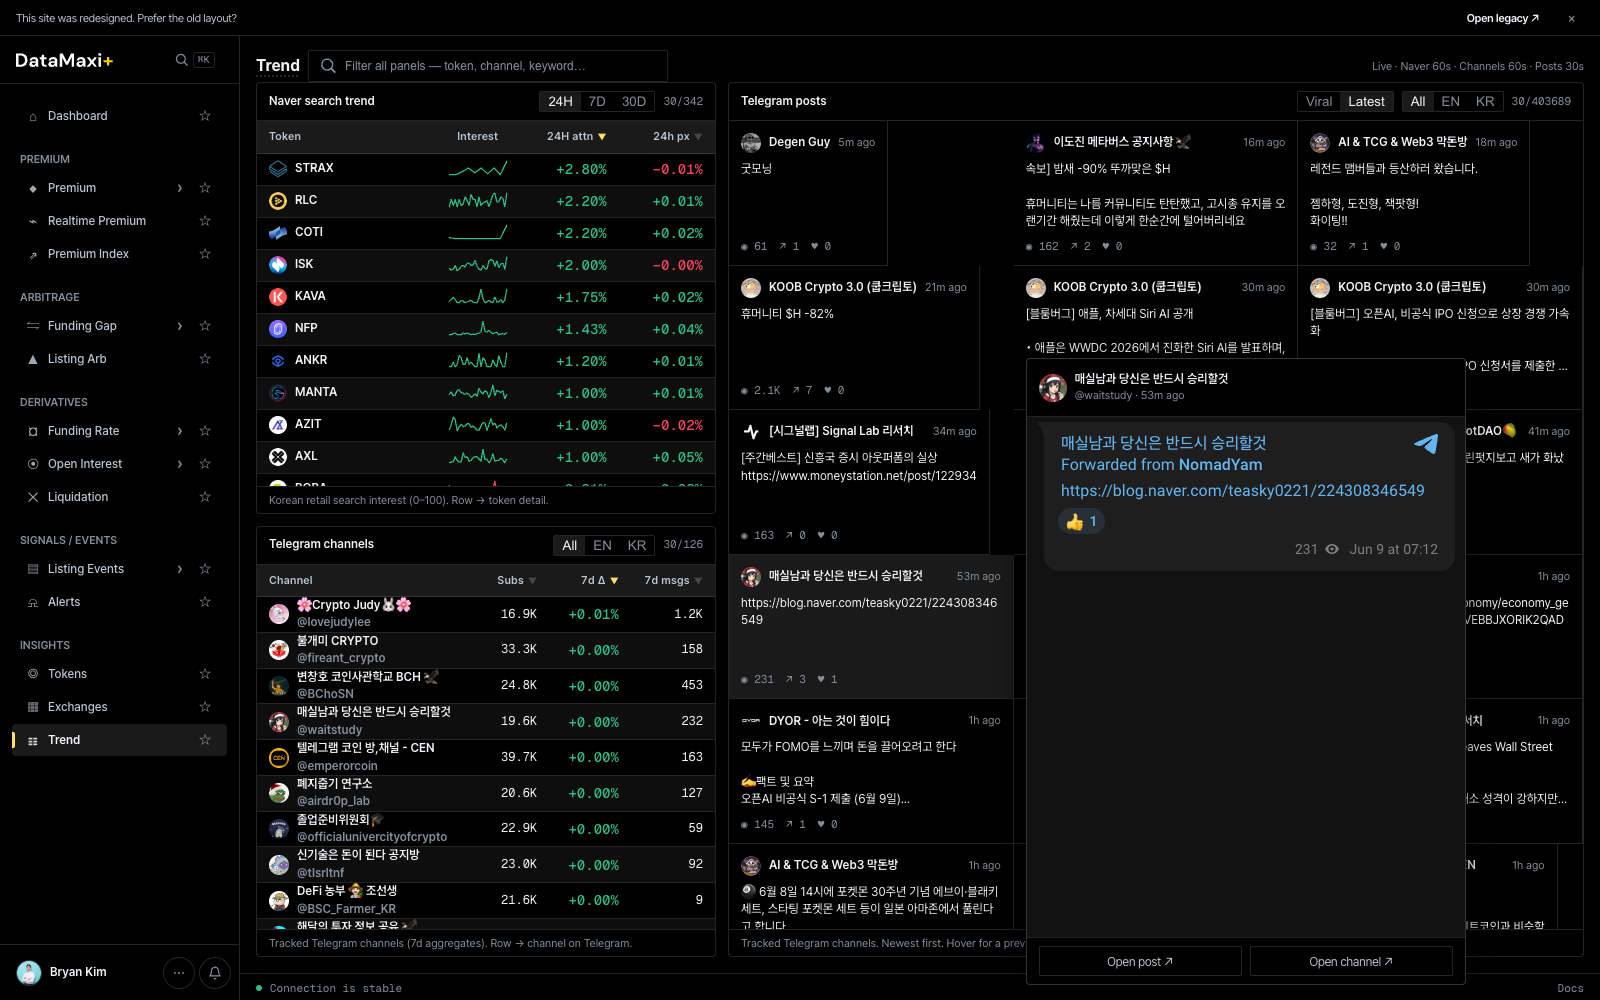
Retail attention as a leading indicator — Naver search trends and Telegram channel volume, paired with price.
Window selector
Top-right: 24H · 7D · 30D. Sets the rolling window for the search-attention and channel-volume figures.
Token search trends (left table)
| Column | Description |
|---|---|
| Token | base asset (with ticker pair where applicable) |
| Interest | a small sparkline of search interest over the window |
| 24H attn ▼ | change in attention vs. the prior period |
| 24h px ▼ | corresponding 24h price move |
Useful tells: tokens with a sharp 24H attn spike but flat / lagging 24h px sometimes lead a move; the inverse (price moved, attention flat) often mean-reverts.
Filter pills above: All · EN · KR to scope the language source for the trend signal. Load more (30/342) paginates the universe.
Telegram channels (left, bottom section)
Ranked list of monitored Telegram channels by recent message volume. Each row shows the channel + member count + message-rate stats. Useful for sentiment context — which channels are heating up.
Telegram channel feed (right column)
A live, scrollable feed of recent Telegram channel messages from the monitored set. Filter pills above:
- Viral · Latest — sort modes (highest engagement first vs. newest first).
- All · EN · KR — language filter.
Each card shows the channel, the message text, and a relative timestamp.
Detail view
Clicking any row in the Token search trends table navigates to /token/<token-id> — the same per-token detail template documented on Tokens. The trend page is essentially a discovery surface that hands off to the canonical token detail for deeper investigation.
When to use this page
- You trade narrative — see what's actually getting attention before it shows up in price.
- You're checking a token's KR-side traction (KR pill) — relevant for KRW-market listings and kimchi-direction trades.
- You want a low-latency read on Telegram alpha without watching every channel by hand.