Tokens
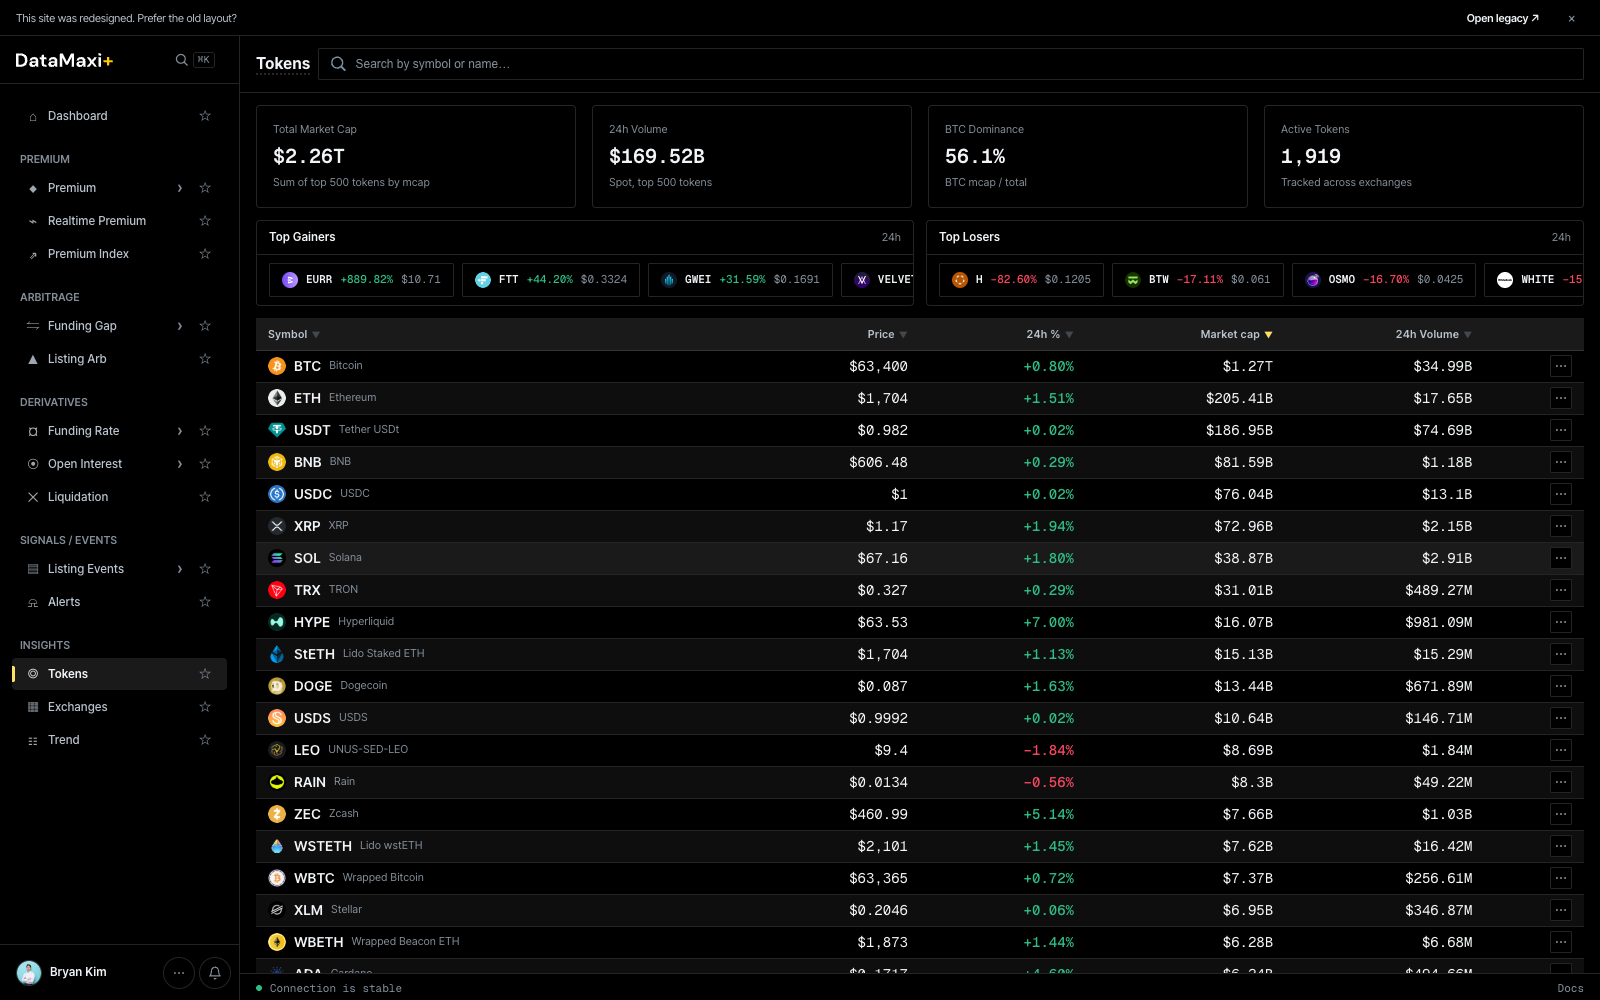
A universal token catalog — every asset DataMaxi+ tracks, sortable on the columns that matter.
Header KPIs
Four cards across the top summarize the current state of the catalog:
- Total Market Cap — sum of tracked tokens.
- 24h Volume.
- BTC Dominance (%).
- Active venues count.
Top Gainers / Top Losers
Two side-by-side strips just below the KPIs:
- Top Gainers (24h) — biggest positive movers.
- Top Losers (24h) — biggest decliners.
Each row shows the token, price, and 24h %.
Main table
| Column | Description |
|---|---|
| Symbol ▼ | base asset ticker + name |
| Price ▼ | last price in USD |
| 24h % ▼ | 24h price change |
| Market cap ▼ | circulating supply × price |
| 24h Volume ▼ | aggregate 24h trade volume |
Every column header is sortable. The footer Load more (30/1919) paginates through the full catalog — there are ~1,919 tracked tokens at time of writing.
Detail view
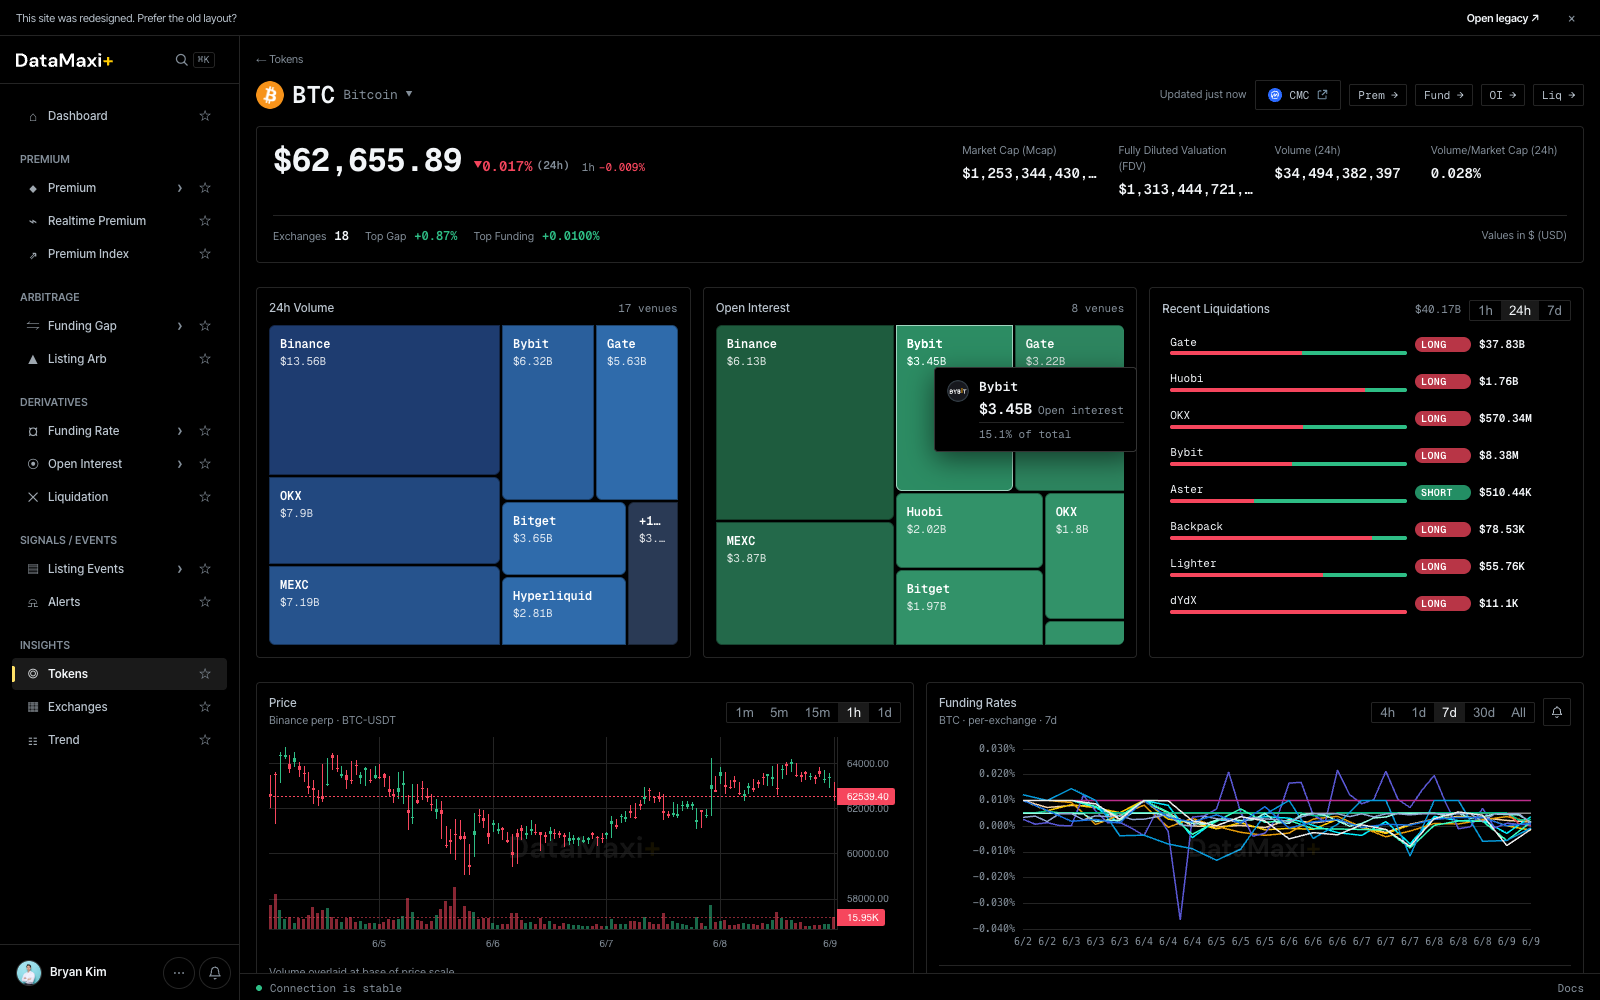
Clicking any row navigates to /token/<token-id> — a dedicated token detail page.
Header
- Symbol + name + current price + 24h %.
- Live trading badges: which venues currently quote the token, with the highest-volume venue pinned first.
Treemaps
Side-by-side per-venue breakdowns for the selected token:
- 24h Volume — venue share of spot volume for this token.
- Open Interest — venue share of perp OI for this token.
- Liquidations (right strip) — per-venue long/short liquidation events.
OI & Volume / Liquidation charts (mid-page)
Below the treemaps, two large chart blocks span the page side-by-side:
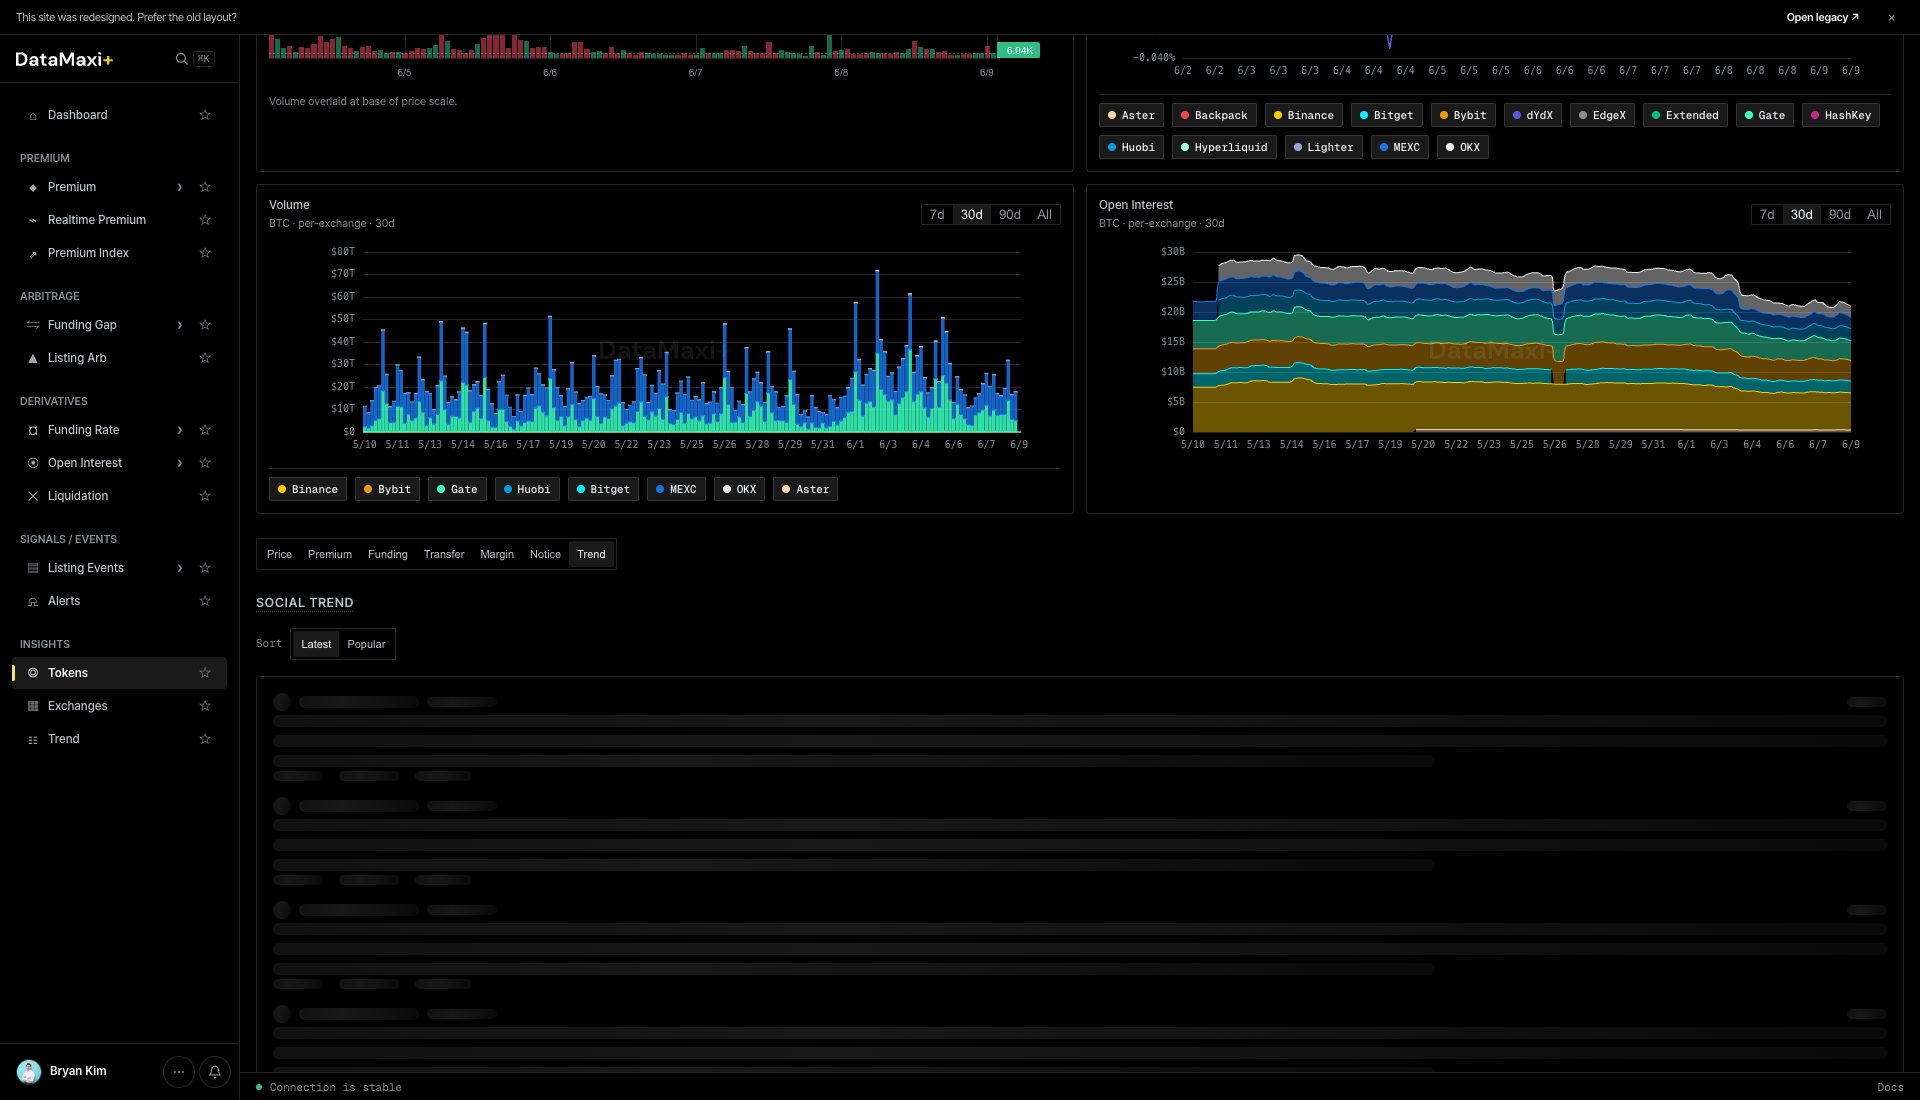
- Volume (left) — a stacked-bar per-venue 24h volume chart over the chosen window (
1m · 5m · 15m · 1h · 1d). Color bands map to the venue chips above the chart (Binance, Bybit, OKX, MEXC, …). Drag the bottom slider to zoom into a specific window. - Open Interest (right) — stacked-area per-venue perp OI chart over the same window. Same color encoding as the Volume chart, with
1d · 7d · 30d · Allrange selectors. Lets you spot which venue's OI is growing or shrinking relative to the others.
Sub-tabs (bottom of page)
Below the charts sits a row of sub-tabs that swap out the bottom panel: Price · Premium · Funding · Transfer · Margin · Notice · Trend.
Each tab is a focused, venue-comparing surface for one dimension of the token.
Price
Default sub-tab. Cross-venue price ladder + per-venue last-price table for the token.
Premium
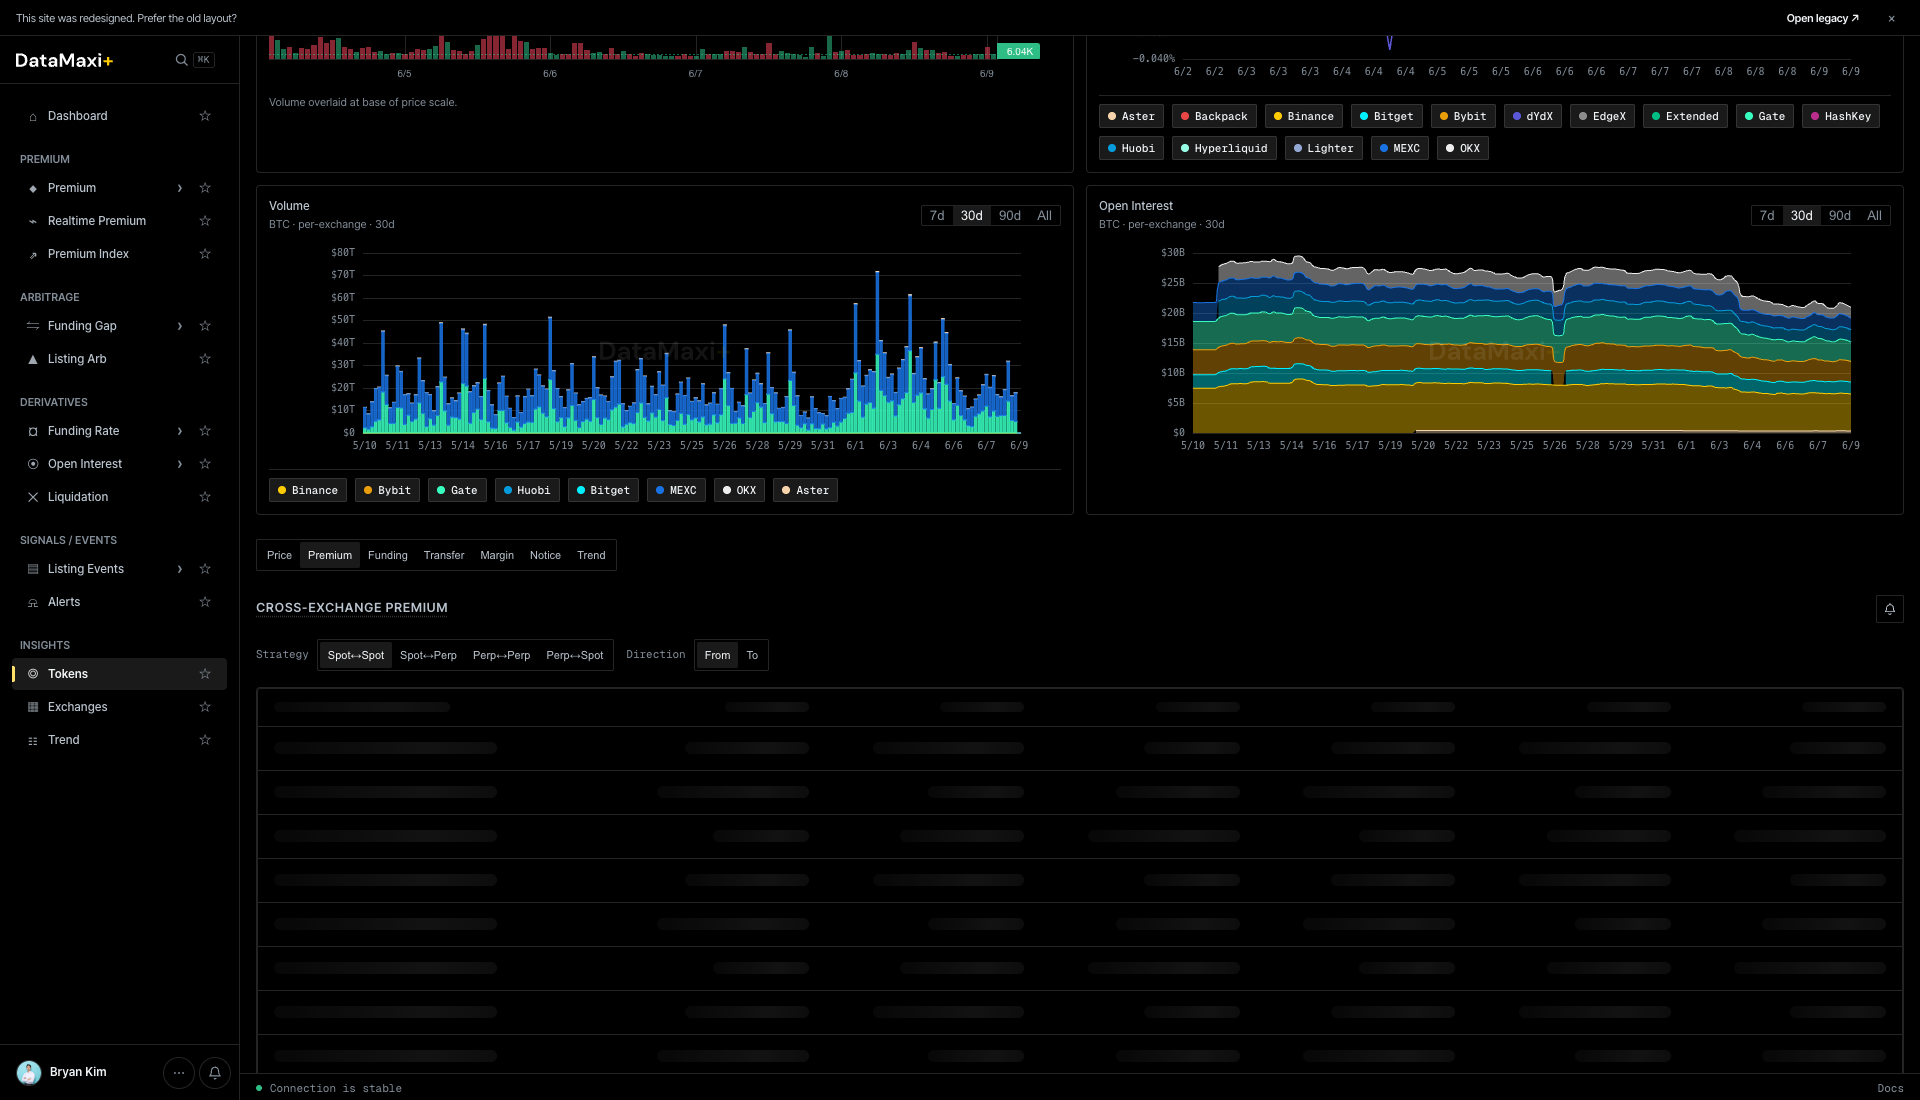
Cross-exchange premium for this token, with leg-type pills along the top (Spot–Spot · Spot–Perp · Perp–Spot · Perp–Perp · Direction…). Below, a per-pair ladder showing live premium per venue pair — the same data as the Premium screener filtered to this asset.
Funding
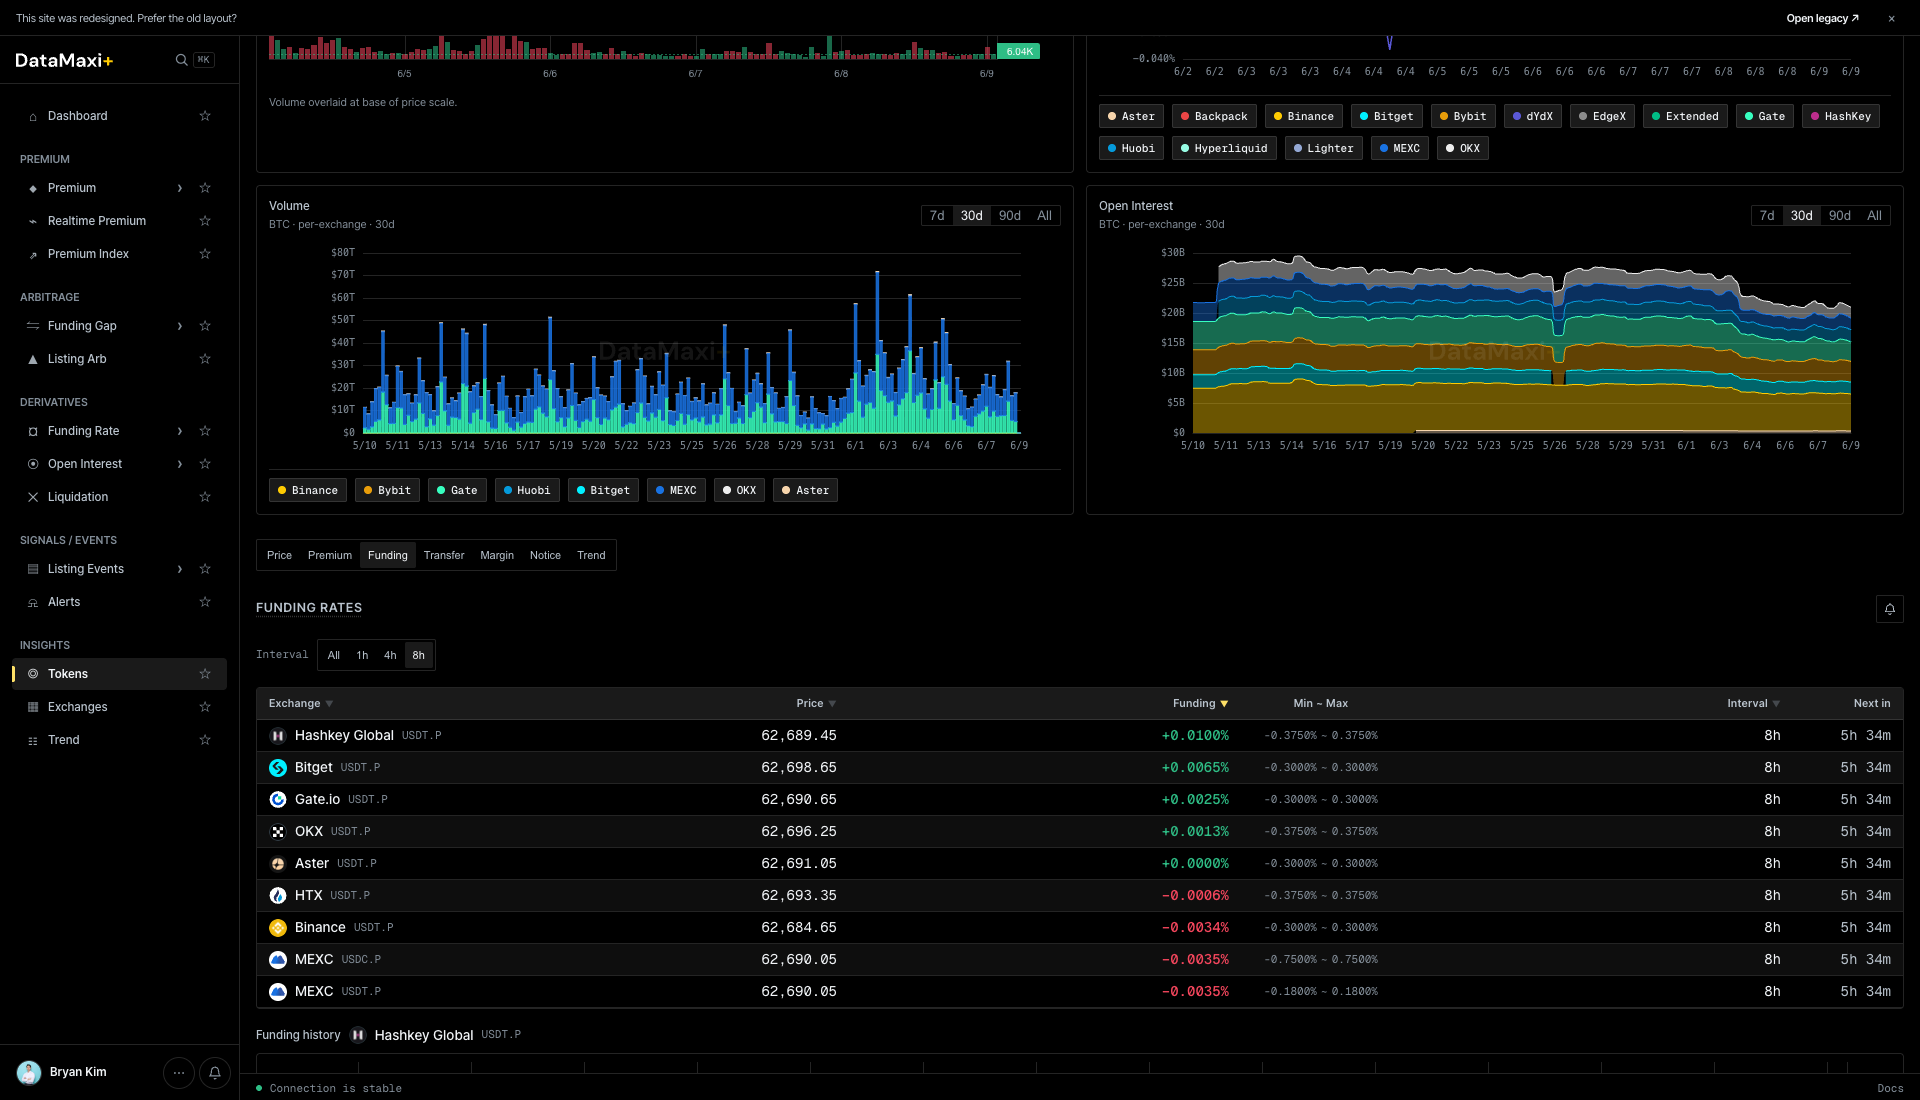
A per-venue funding-rate table for the token — current funding, min–max, interval, next-settlement. Same shape as a single row inside Funding Rate, expanded.
Transfer
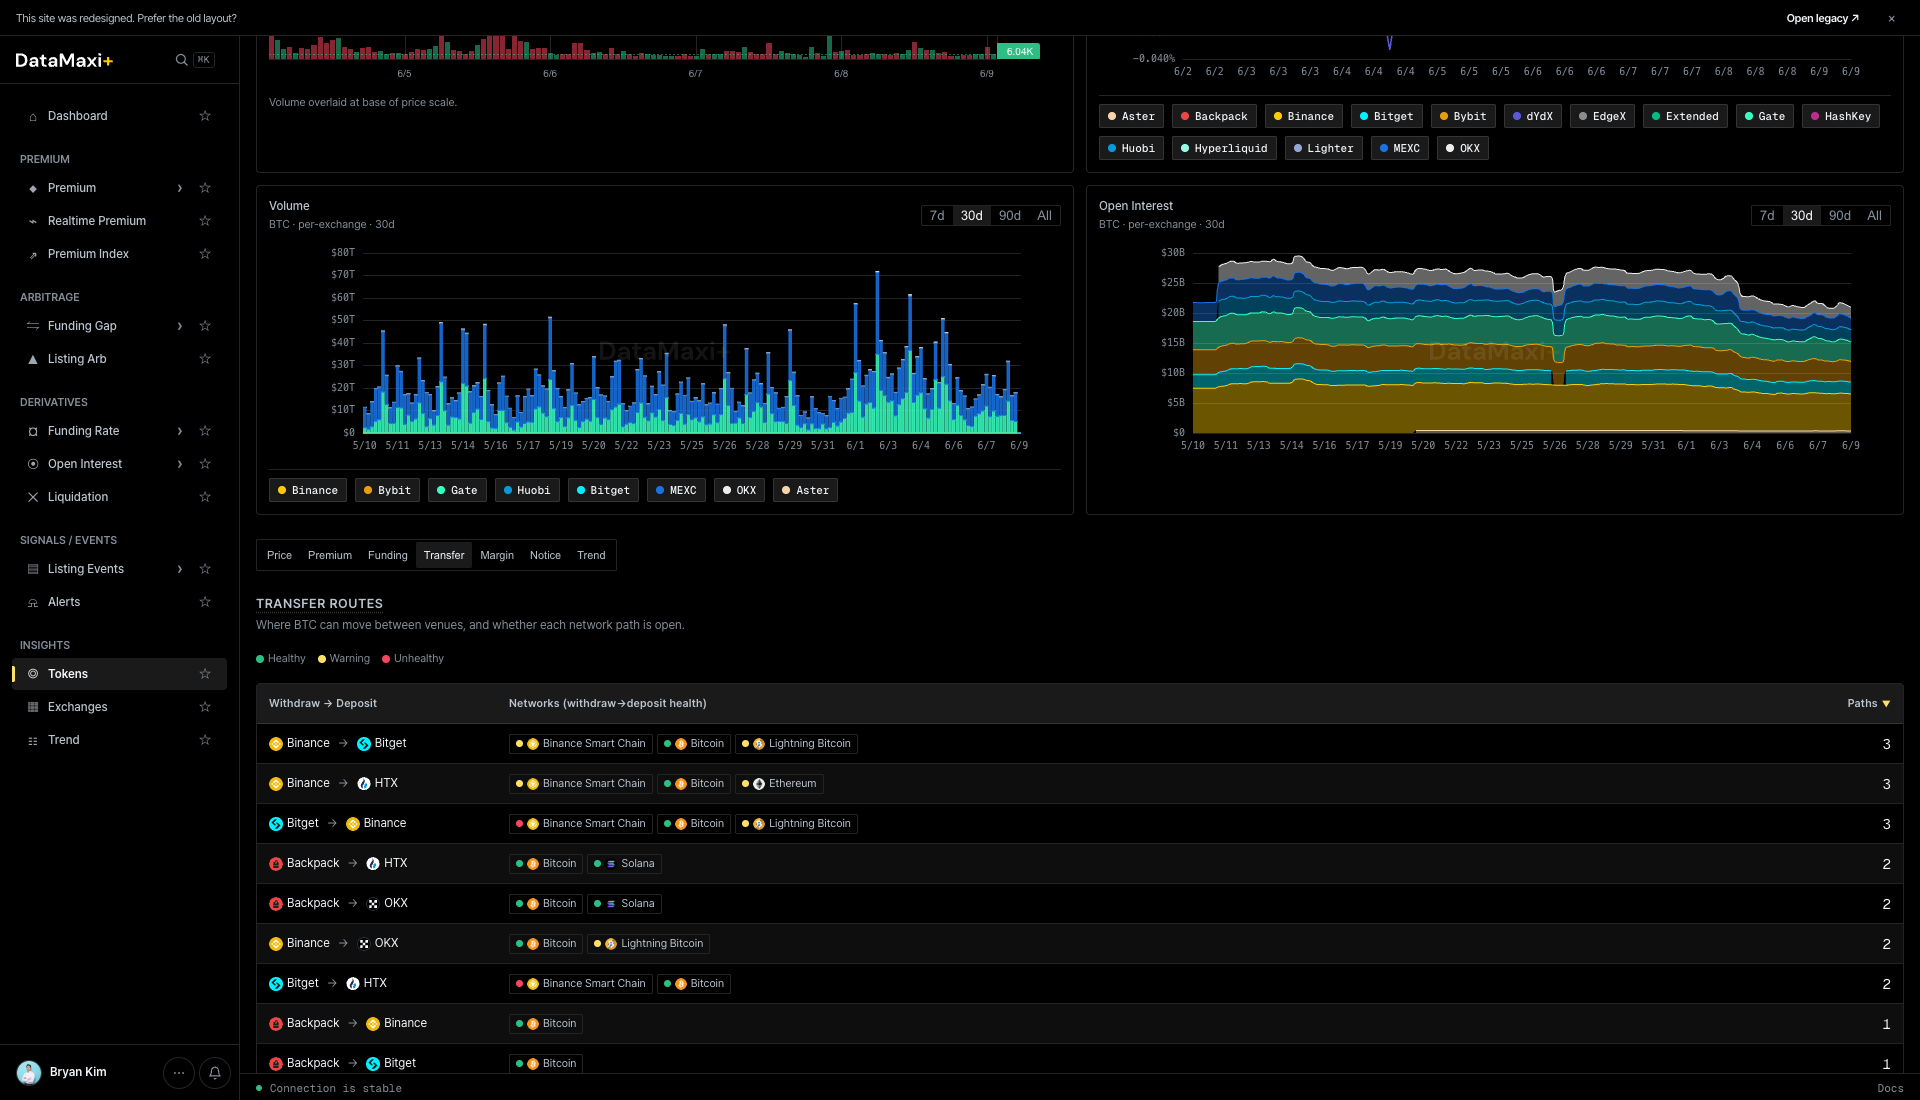
Transfer routes — a matrix of withdraw → deposit venue pairs with the supported networks. Use it to plan the cheapest / fastest route when you need to move the token between venues to capture a spread. The Faster ↓ column ranks routes by typical settlement speed.
Margin
Margin-borrow rates per venue for the token — relevant if your strategy needs to short the spot leg.
Notice
Per-venue exchange notices and announcements that mention this token (listings, delistings, caution-tag changes, fee changes, network upgrades).
Trend
Social trend for the token — Telegram channel mention volume + Naver search interest pulled from the Trend data, with Latest / Popular sort. Useful when you suspect a narrative is driving the price move.
The same detail template is used by the Trend page: clicking a Trend row jumps to /token/<token-id> for the underlying asset.
When to use this page
- You're sizing the universe — how many tokens fit a market-cap or volume threshold for a strategy.
- You're checking liquidity on a candidate before trading it.
- You want a quick "rank by 24h move" sanity check on the broad market.