Arbitrage Page
The Arbitrage page provides tools to identify and analyze arbitrage opportunities across multiple exchanges.
There are three major arbitrage strategies:
- Arbitrage across Spots
- Arbitrage between Spot and Perpetual
- Arbitrage Funding Rates across Exchanges
Arbitrage across Spots
Spot arbitrage involves buying a cryptocurrency on one spot market and selling the same cryptocurrency on another spot market where the price is higher.
Spot arbitrage involves buying a cryptocurrency on one spot market and selling it on another spot market where the price is higher.
On the Spot Arbitrage page, you will find key metrics to help you make informed decisions:
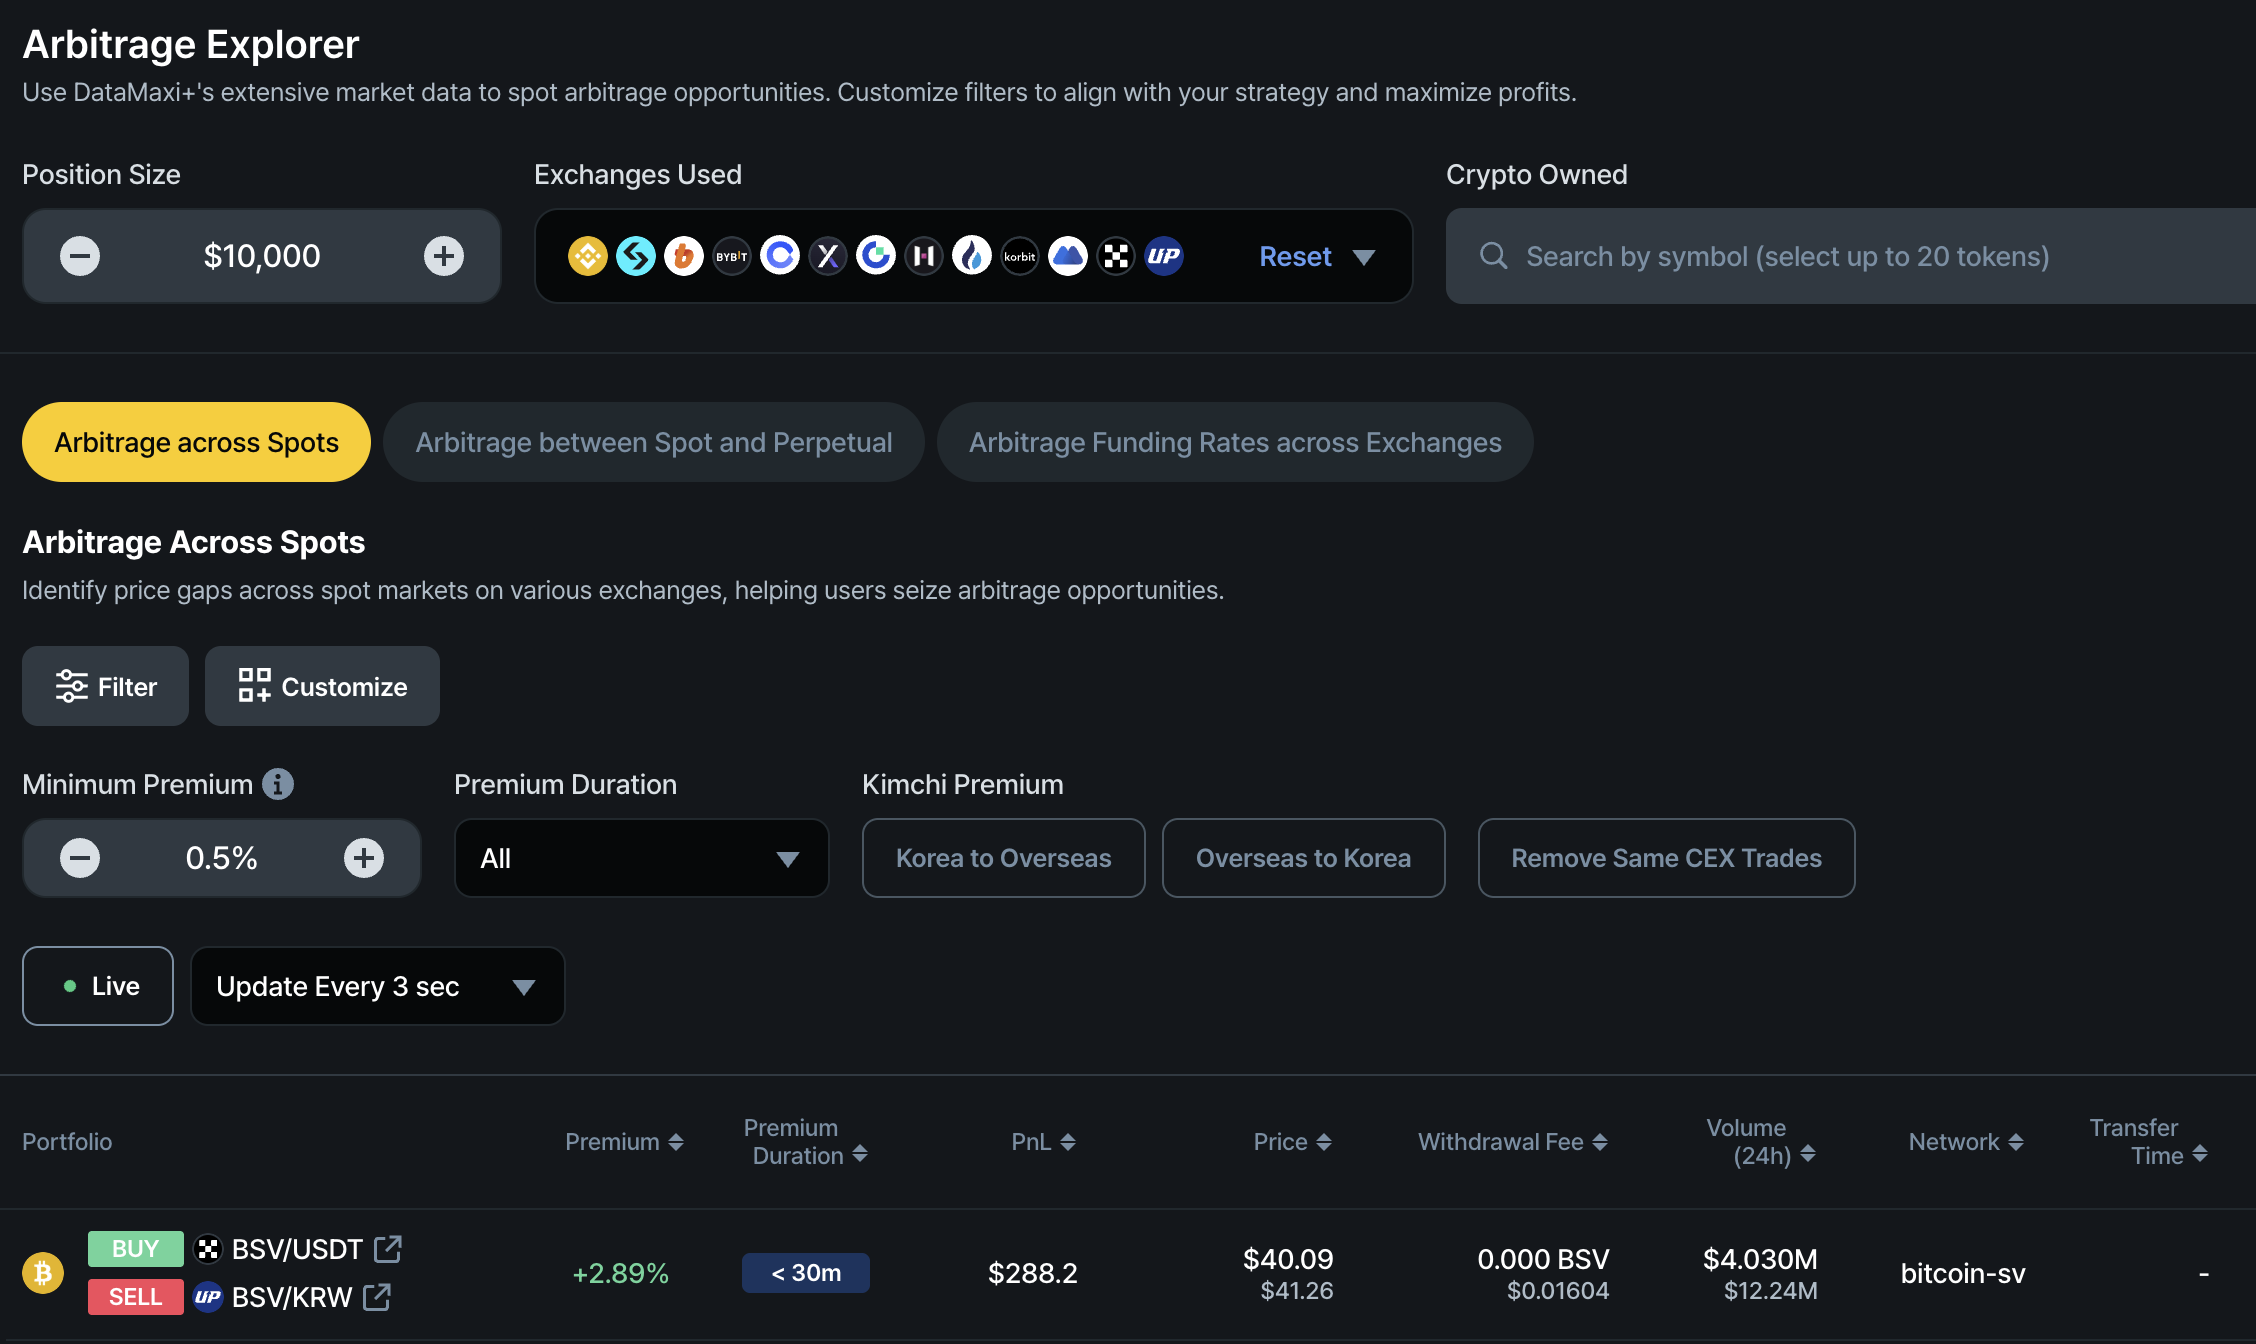
- Premium: The percentage price difference between two exchanges.
- Premium Duration: An estimate of how long the price discrepancy (premium) is expected to last.
- PnL (Profit and Loss): The estimated profit from completing the arbitrage trade based on the position size. The default position size is US$10,000, but you can adjust it based on market conditions and available capital.
- Price: The real-time mid-price of the cryptocurrency on both exchanges, calculated based on the order book. This is a key differentiator of DataMaxi+ compared to similar products that rely on historical settled prices, which may not be actionable in real-time trading scenarios.
- Withdrawal Fee: If you do not currently hold the cryptocurrency, you will need to buy it on one exchange (where the price is lower) and transfer it to another exchange (where the price is higher). The withdrawal fee should be factored into your profit-and-loss (PnL) calculations when executing such trades.
- Volume (24h): The trading volume of the cryptocurrency on both exchanges.
- ⚠ Note: If the volume is extremely low, the arbitrage opportunity may not be practically executable despite a high premium or discount.
- Network: The blockchain network used to transfer the cryptocurrency between exchanges.
- Transfer Time: The estimated time required to complete the cryptocurrency transfer from one exchange to another.
Spot arbitrage is the default strategy displayed when you open the arbitrage page. To switch to another strategy, click ‘Arbitrage between Spot and Perpetual’.
Arbitrage between Spot and Perpetual
This strategy takes advantage of funding rate differentials between the spot and perpetual futures markets.
Spot-perpetual arbitrage is delta-neutral, meaning the trader hedges against price movement risks by holding offsetting positions in both markets.
There are two types of spot-perpetual arbitrage:
- Positive Carry: When the funding rate is positive, a trader can earn funding fee income by purchasing the asset in the spot market while short-selling an equivalent position in the perpetual market.
- Reverse Carry: When the funding rate is negative, a trader can profit by shorting the asset in the spot market (e.g., selling it at the current price) and going long on an equivalent leveraged position in perpetual futures.
Both setups—positive carry and reverse carry—are shown in the search results.
- A "buy in spot and short in perpetual" signal indicates a positive carry opportunity.
- A "buy in perpetual and short in spot" signal indicates a reverse carry opportunity.
Key Metrics for Spot-Perpetual Arbitrage
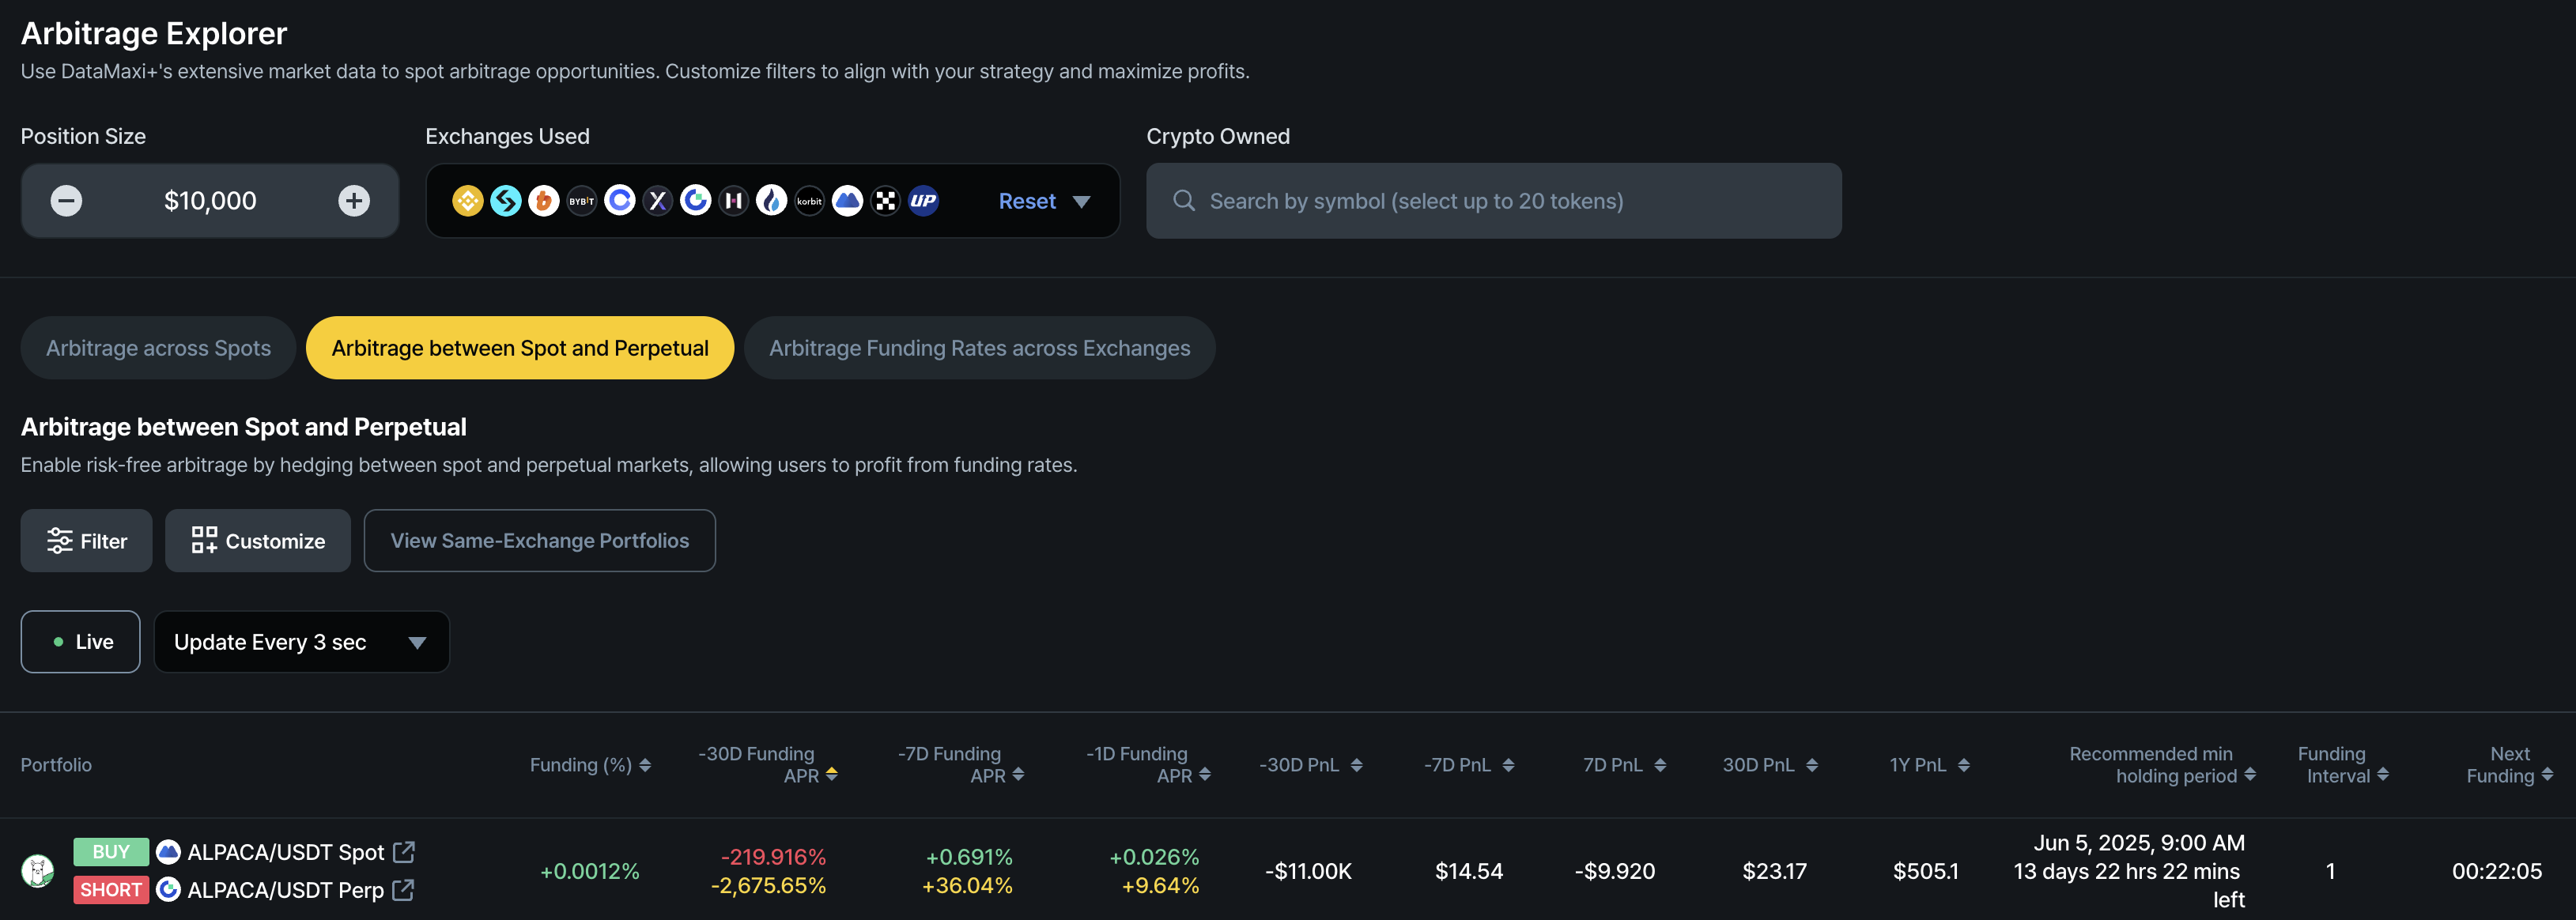
- Funding (%): The current funding rate at the ongoing funding cycle.
- -30D Funding APR: The accumulated funding rate over the past 30 days. The red bar represents the actual historical funding rate for this period, while the orange bar below it shows the annualized percentage based on that 30-day accumulated rate.
- -7D Funding APR: The accumulated funding rate over the past 7 days. The red bar represents the actual historical funding rate for this period, while the orange bar below it shows the annualized percentage based on that 30-day accumulated rate.
- -1D Funding APR: The accumulated funding rate over the past 1 day. The red bar represents the actual historical funding rate for this period, while the orange bar below it shows the annualized percentage based on that 30-day accumulated rate.
- -30D PnL: The historical 30-day accumulated profit and loss in dollar terms, after deducting estimated transaction fees (assumed to be 0.2%), based on the selected position size.
- -7D PnL: The historical 7**-day** accumulated profit and loss in dollar terms, after deducting estimated transaction fees (assumed to be 0.2%), based on the selected position size.
- 7D PnL: The projected 7-day profit and loss, net of estimated transaction fees (assumed to be 0.2%), based on the current funding rate.
- 30D PnL: The projected 30-day profit and loss, net of estimated transaction fees (assumed to be 0.2%), based on the current funding rate.
- 1Y PnL: The projected 1-year (365-day) profit and loss, net of estimated transaction fees (assumed to be 0.2%), based on the current funding rate.
- Recommended Minimum Holding Period: The estimated minimum duration required to hold the arbitrage position in order to break even on transaction fees (0.2%), based on the current funding rate (%). The estimated end date and time for this holding period are also provided.
- Funding Interval: The number of hours between funding payouts. This varies by exchange and trading pair but is typically 4 or 8 hours, with some cases as short as 1, 2, or 3 hours.
- Next Funding: The estimated time remaining before the upcoming funding interval.
Arbitrage across Perpetuals
This strategy identifies and captures profit opportunities arising from:
1. Price Discrepancy Arbitrage
Exploiting price differences for two perpetual contracts of the same underlying asset across exchanges.
How it works:
- Go long on the lower-priced contract (Exchange A)
- Go short on the higher-priced contract (Exchange B)
- Close both positions when prices converge to realize profit from the spread
2. Funding Rate Arbitrage
Earning profits from funding rate differentials while maintaining market-neutral exposure.
How it works:
- Hold long and short positions across two exchanges
- Earn funding on one leg while potentially paying (or also earning) on the other
- Profit depends on the net funding rate across the combined position
Total Profit = Price Discrepancy Arbitrage + Funding Rate Arbitrage
DataMaxi+ identifies these opportunities in real time, accounting for both price discrepancies and net funding returns.
It automatically filters out arbitrage setups where net funding is negative, unless the price spread is large enough to offset the loss.
Key Metrics for Spot-Perpetual Arbitrage
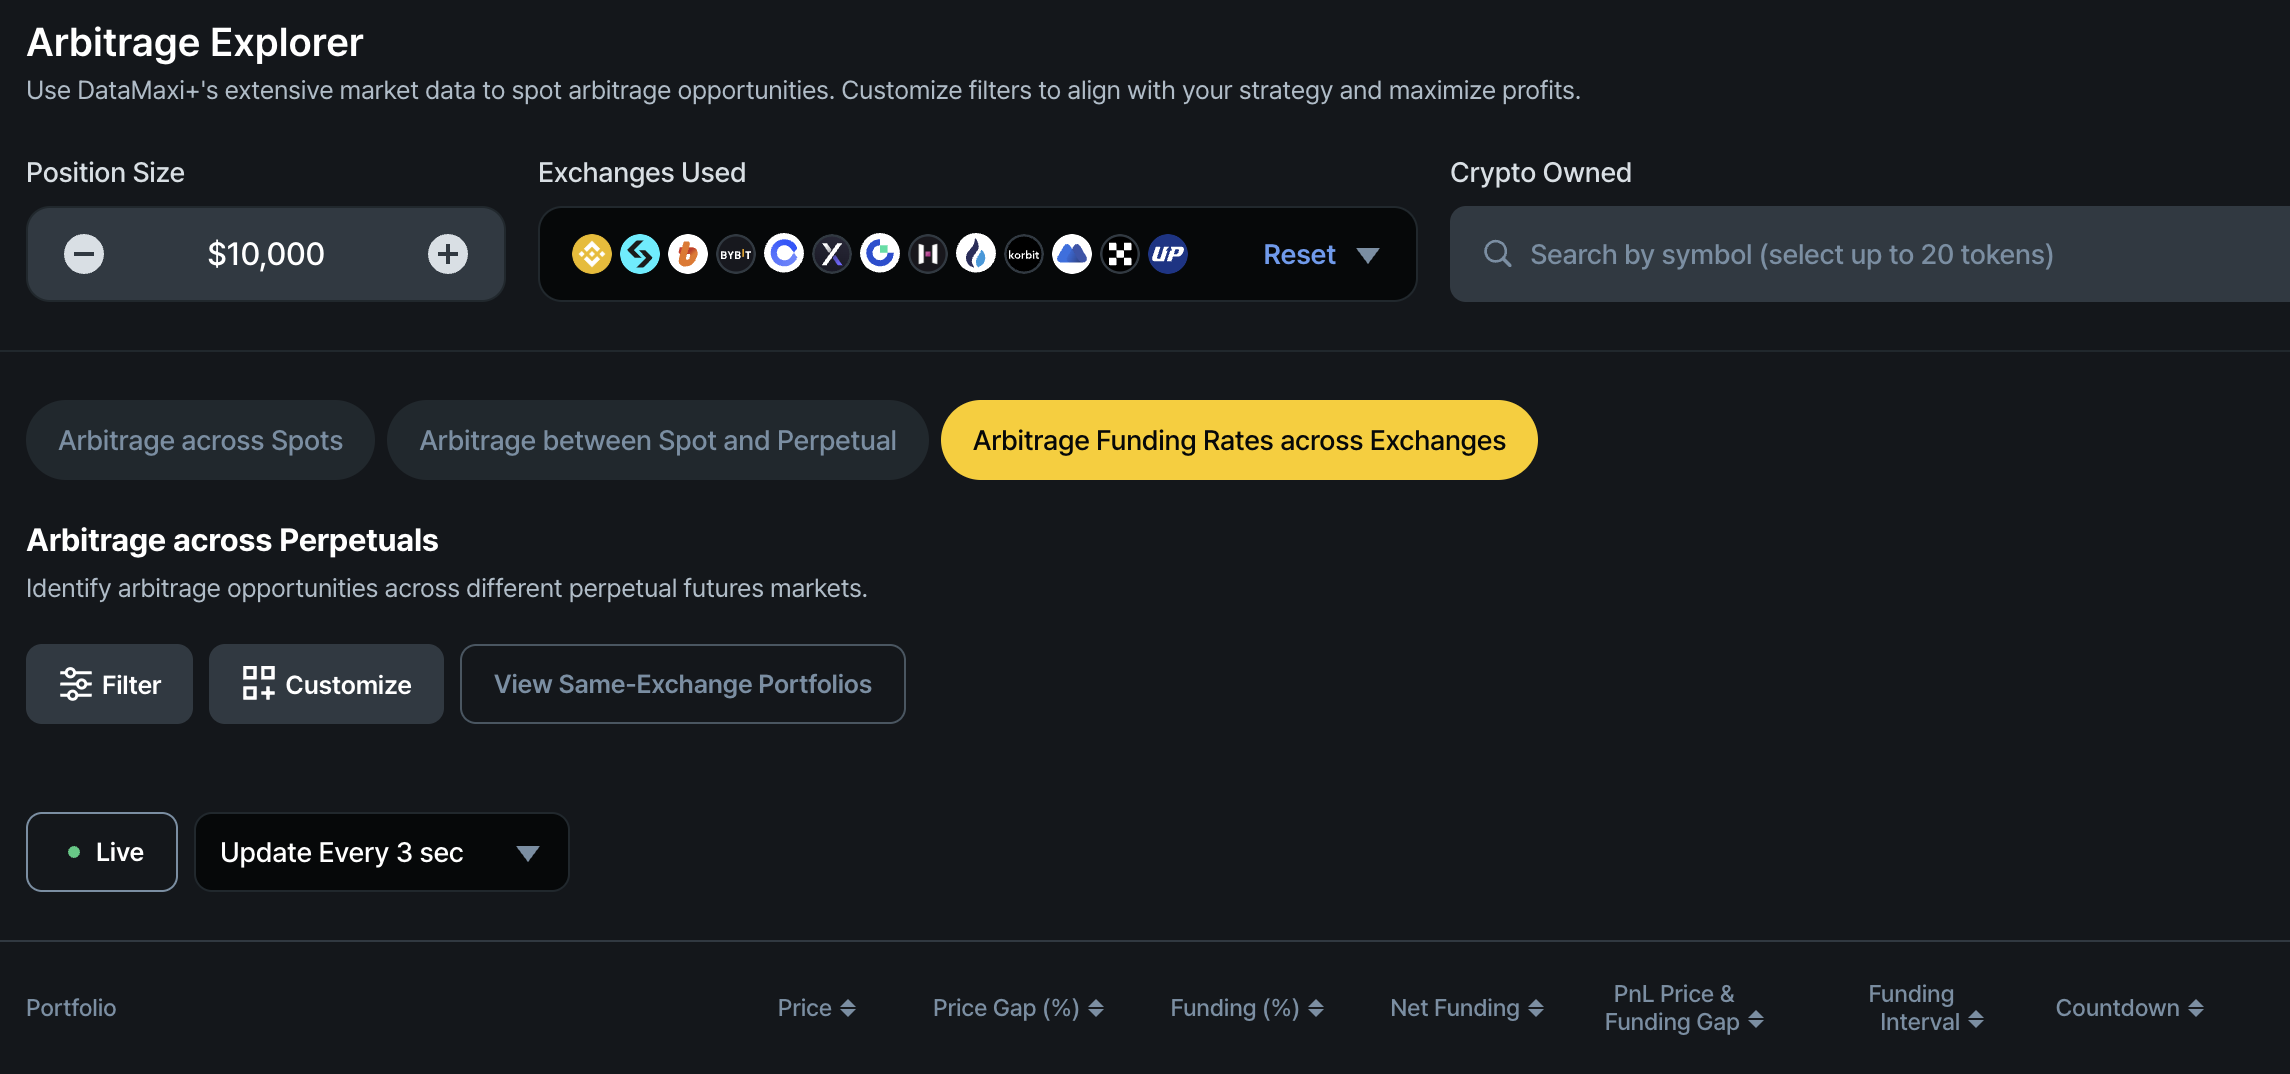
- Price: The mid-price computed from order book data of the perpetual contracts on both exchanges.
- Price Gap (%): The percentage difference between the perpetual contract prices on the two exchanges, representing the price discrepancy arbitrage opportunity.
- Funding (%): The current funding rates of the perpetual contracts on both exchanges during the ongoing funding interval.
- Net Funding: The net funding rate you earn (or pay) after accounting for both sides of the trade during the funding interval. If the funding intervals differ between exchanges, the shorter interval's rate will be scaled to match the longer one for an apples-to-apples comparison.
- PnL (Price & Funding Gap): The calculation is based on the position size specified by user. The default value for the position size is $10K.
- Funding Interval: The number of hours between funding settlements. This varies by exchange and trading pair—commonly 4 or 8 hours, but sometimes as short as 1, 2, or 3 hours.
- Countdown: The remaining time until the next funding payout.
Profit and Loss (PnL) Metrics
The forward profit and loss is calculated based on the prevailing funding rate at the moment you view the screen.
The profit and loss (PnL) metrics account for estimated CEX transaction fees incurred when opening and closing both spot and perpetual positions required for spot<>perpetual arbitrage. Please note that actual fees may vary depending on your VIP level at each exchange, as well as the exchange’s fee policies and promotions.
- 30D PnL: The historical 30-day accumulated profit and loss in dollar terms, after deducting estimated transaction fees (assumed to be 0.2%), based on the selected position size.
- 7D PnL: The historical 7-day accumulated profit and loss, net of estimated transaction fees (assumed to be 0.2%), based on the selected position size.
- 1D PnL: The historical 1-day accumulated profit and loss, net of estimated transaction fees (assumed to be 0.2%), based on the selected position size.
- 1D PnL: The real-time 1-day profit and loss accrued so far today, net of estimated transaction fees (assumed to be 0.2%).
- 7D PnL: The projected 7-day profit and loss, net of estimated transaction fees (assumed to be 0.2%), based on the current funding rate.
- 30D PnL: The projected 30-day profit and loss, net of estimated transaction fees (assumed to be 0.2%), based on the current funding rate.
- 1Y PnL: The projected 1-year (365-day) profit and loss, net of estimated transaction fees (assumed to be 0.2%), based on the current funding rate.
PnL Calculation Overview
| Metric | Time period | Type | CEX Transaction Fees |
|---|---|---|---|
| -30D PnL | Last 30 days | Historical (Accumulated) | 0.2% (Assumed total) |
| -7D PnL | Last 7 days | Historical (Accumulated) | 0.2% (Assumed total) |
| -1D PnL | Last 1 day | Historical (Accumulated) | 0.2% (Assumed total) |
| 1D PnL | Today (Accrued) | Real-Time (Accumulated) | 0.2% (Assumed total) |
| 7D PnL | Next 7 days | Projected (Estimated) | 0.2% (Assumed total) |
| 30D PnL | Next 30 days | Projected (Estimated) | 0.2% (Assumed total) |
| 1Y PnL | Next 365 days | Projected (Estimated) | 0.2% (Assumed total) |